Environmental Engineering Reference
In-Depth Information
EMCs for E. coli were in the range of 700-84,700
MPN/100 mL; EMCs for fecal coliform in the range of
1500-342,400 MPN/100 mL; and EMCs for enterococci
in the range of 1300-181,800 MPN/100 mL. A detailed
study in Austin, Texas, quantified several EMCs as a
(multivariate) linear function of the fractions of imper-
vious cover, commercial land use, undeveloped land,
single-family residence, and industrial land use (Glick,
2009). In interpreting all EMC data it is important to
realize that quantitative estimation of the EMC is sensi-
tive to the method used to collect the water-quality
samples, with flow-weighted samplers producing the
most accurate results and grab samples the least accu-
rate results.
Land use information is usually the basis for specify-
ing the EMC for any particular area, and the needed
land use information is typically obtained from public
records. In areas where land use data is not available or
affordable, estimation of land use from publicly avail-
able satellite imagery is a viable alternative. however,
care should be taken in assuming that land use is the
only factor influencing the quality of runoff, since it has
been shown that geologic setting has a significant effect
on constituent levels of nutrients, metals, and suspended
solids at natural sites (Yoon and Stein, 2008), and local
climate can have a dominating effect on levels of sus-
pended solids in stormwater runoff (he et al., 2010).
For large heterogeneous watersheds, the prediction of
the quality of surface runoff using EMCs can be easily
implemented on a GIS platform.
Sewage treatment plants providing secondary treat-
ment are typically expected to remove at least 85% of
the BOD and SS from raw sewage, and keep the BOD
and SS of treated wastewater below 30 mg/L prior to
discharge into a receiving water body. Given the typical
characteristics of urban runoff shown in Table 6.3, this
indicates that urban runoff could contain BOD and SS
concentrations comparable with or much higher than
the concentrations in treated sewage.
The unit load of a pollutant in runoff from ungaged
urban watersheds can be estimated using the relation
1.0
0.9
0.8
0.7
0.6
0.5
0.4
0.3
0.2
0.1
0
10
20
30
40
50
60
70
80
90
100
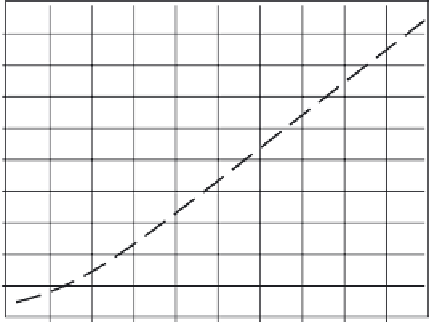
Percent imperviousness
Figure 6.3.
Runoff coefficients derived from NURP studies.
Source
: USEPA (1983a).
the runoff coefficient,
C
, shown in Figure 6.3 can be
approximated by
I
C
=
0 05 0 9
.
+
.
(6.4)
100
where
I
is the percent imperviousness of the catchment
area. An alternative estimate of
C
suggested by Guo
and Cheng (2008) using the same data is
3
2
I
I
I
C
=
0 858
.
−
0 780
.
+
0 774
.
+
0 04
.
100
100
100
(6.5)
Utilization of Equation (6.2) to calculate the pollutant
load in surface runoff from urban areas is called the
simple method
and is considered applicable to areas less
than 2.6 km
2
(1 mi
2
). The rainfall depth,
P
, in Equation
(6.2) can be expressed in the form
P P P
j
=
(6.6)
o
load kg/ha
(
)
=
0 01
C P
.
×
EMC
(6.2)
where
P
o
is the rainfall depth over the desired time
interval, and
P
j
is a factor that corrects
P
o
for storms that
produce no runoff. The factor
P
j
is typically equal to the
fraction of annual or seasonal rainfall that does not
produce runoff, and for individual storms it is commonly
assumed that
P
j
= 1.
where
C
is the runoff coefficient (dimensionless) defined
by
C
=
volume of runoff
volume of rainfall
(6.3)
where
P
is the rainfall depth (mm), and the EMC is
expressed in mg/L (= g/m
3
). The runoff coefficient,
C
,
can be estimated using the (NURP) data plotted in
Figure 6.3, or by any other data that might better
describe local conditions. According to Schueler (1987),
EXAMPLE 6.1
An urban (residential) area is estimated to be 40%
impervious and to have an average annual rainfall of


Search WWH ::

Custom Search