Environmental Engineering Reference
In-Depth Information
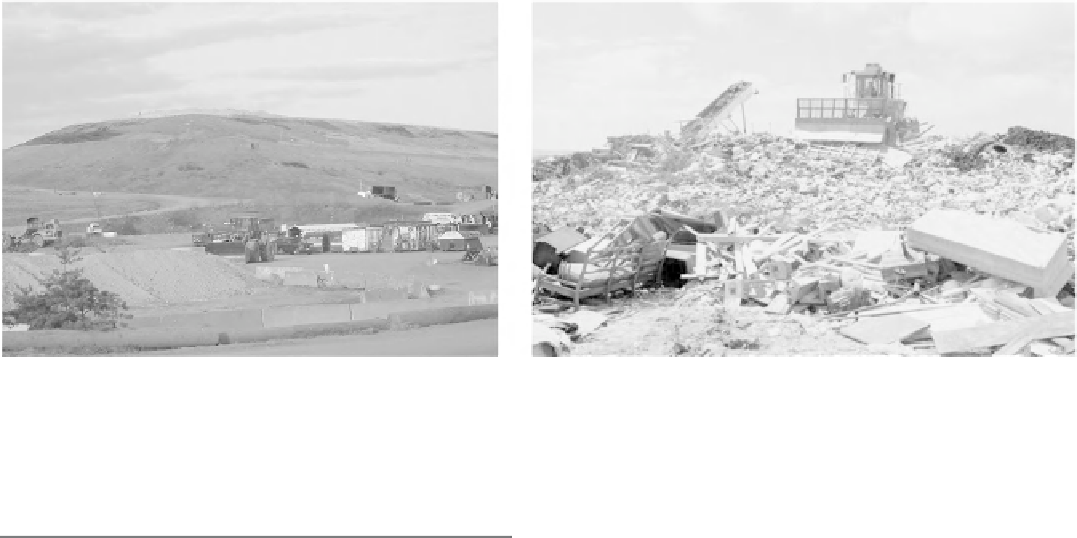
(a)
(b)
Figure 5.5.
Landfill: (a) closed, far view; (b) open, near view.
Sources
: Energy Information Administration (2005) and Prince
William Conservation Alliance (2005).
TABLE 5.1. Leachate Characteristics from Municipal Solid
Waste Disposal Sites
median
Value
Ranges of
All Values
Component
(mg/L)
(mg/L)
Alkalinity (as CaCO
3
)
3050
0-20,850
Biochemical oxygen demand
(BOD
5
)
5700
81-33,360
Chemical oxygen demand (COD)
8100
40-89,520
Copper (Cu)
0.5
0-9.9
Lead (Pb)
0.75
0-2.0
Zinc (Zn)
5.8
3.7-8.5
Chloride (Cl
−
)
700
4.7-2500
Sodium (na
+
)
767
0-7700
Total dissolved solids (TDS)
8955
584-44,900
218
0-1106
Ammoniacal nitrogen (
NH
+
)
10
0-30
Total phosphate (
PO
3+
)
Iron (Fe)
94
0-2820
manganese (mn)
0.22
0.05-125
pH
5.8
3.7-8.5
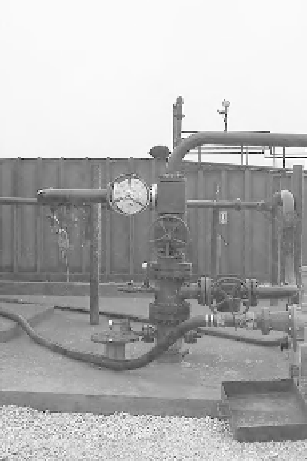
Figure 5.6.
Injection well.
Source
: U.S. Department of
Energy (2012).
Source
: USEPA (1977).
inadequate understanding of the subsurface geology,
and deteriorated well casings can all cause contami-
nants to be introduced into drinking-water sources. The
wellhead of an injection well is shown in Figure 5.6.
5.3 FATE AND TRANSPORT MODELS
Contaminants in groundwater undergo a variety of
fate and transport processes. Fate processes change
the amount of contaminant, and transport processes
contribute to the physical movement of the contami-
nant. The fate processes that are most often consid-
ered in groundwater include sorption onto the solid
matrix and first-order decay. Transport processes include
net advection by the mean (large-scale) groundwater
seepage velocity and mixing caused by small-scale vari-
ations in the seepage velocity associated with spatial
5.2.7 Agricultural Operations
The uses of pesticides and fertilizers in agricultural
practice are significant sources of synthetic organic
chemicals and nutrients in groundwater. The impact of
agricultural practices on groundwater quality are dis-
cussed extensively in Section 6.3.


Search WWH ::

Custom Search