Environmental Engineering Reference
In-Depth Information
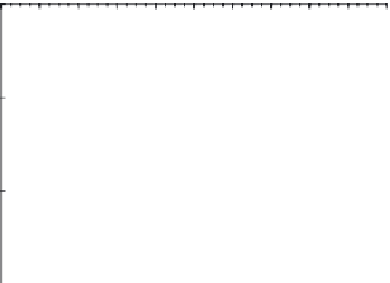
The corresponding LDC is plotted in Figure 4.14.
Based on these data, the maximum allowable loadings
under 10 and 40% exceedances are 1.04 × 10
14
CFU/d
and 2.50 × 10
13
CFU/d, respectively. A mid-range FC
load corresponds to and exceedance percentage of
(40% − 10%)/2 = 25%, which corresponds to a load of
4.53 × 10
13
CFU/d.
the allocation of contaminant loadings to streams; (2)
provide an indication of whether the likely sources of
water-quality violations are point or nonpoint sources,
and (3) provide a basis for estimating load reductions
required for streams to meet their applicable water-
quality standards.
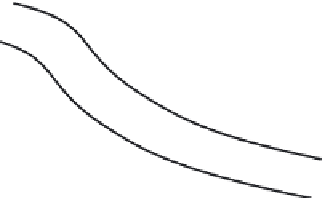
Load Allocation.
Consider the typical case of a stream
segment shown in Figure 4.15, where the contaminant
load from upstream of the segment is
L
u
(MT
−1
), point
source loads within the stream segment are
L
pi
(MT
−1
),
where
i
is an index referring to a distinct point source,
the nonpoint source load is
L
np
(MT
−1
), and the total
load at the downstream end of the stream segment is
L
T
(MT
−1
), which is equal to
Qc
, where
Q
(L
3
T
−1
) and
c
(ML
−3
) are the flow and contaminant concentration,
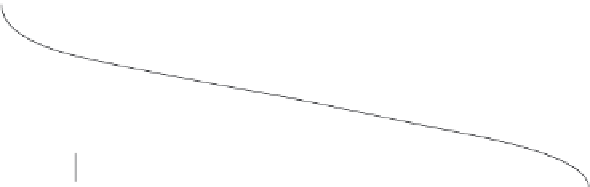
respectively. Under usual circumstances, the loads asso-
ciated with point sources are independent of the flow
rate,
Q
, in the stream, and these point source loads can
be represented as a horizontal line in the LDC as shown
in Figure 4.16. At each flow rate, the remaining load
between the TMDL (as defined by the LDC) and the
point source loads can be allocated to the sum of
upstream load, nonpoint load directly to the stream
segment, and a margin of safety (MoS) that accounts
for the uncertainties in estimating the allocated loads.
Although there are a variety of ways to account for the
4.7.1.2 Applications of the Load Duration Curve.
Widely used applications of the LDC are to: (1) guide
10
15
load duration curve
10
14
4.53
×
10
13
CFU/d
10
13
10
12
0
10
20
30
40
50
60
70
80
90 100
exceedance percentage (%)
Figure 4.14.
Load duration curve for fecal coliform bacteria.
L
p1
(point load no.1)
L
u
(upstream load)
L
p2
(point load no.2)
L
np
(nonpoint load)
L
T
(total load) =
Qc
Figure 4.15.
Contaminant loads on stream segment.
10
6
margin of safety
10
5
load duration curve (TMDL)
10
4
nonpoint load + upstream load
10
3
10
2
total point source load
0
10
20
30
40
50
60
70
80
90
100
exceedance percentage (%)
Figure 4.16.
Allocation of contaminant loads.


Search WWH ::

Custom Search