Environmental Engineering Reference
In-Depth Information
curve is derived. The procedure for deriving the LDC is
described below.
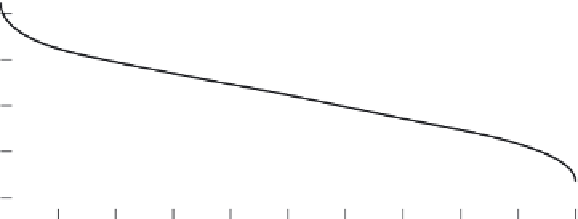
the frequency of occurrence of observed flow
rates, with high flow rates exceeded rarely (< 10%
of the time) and low low rates exceeded fre-
quently (>90% of the time). various descriptors of
the flow conditions are used to characterize the
flows within various flow ranges, with classifica-
tions suggested by USEPA shown in Figure 4.12
and quantified as follows (USEPA, 2007)
Step 1: Gather the Data.
At the stream section of
interest, specify the applicable water-quality stan-
dard,
c
std
, and obtain a long-term record of average
daily flows. In the United States, records of daily-
averaged flows are collected at thousands of loca-
tions by the U.S. Geological Survey (USGS), and
these records can generally be accessed online. If
the stream section of interest does not have a long
record of flow measurements, then alternate esti-
mation methods, such as rainfall runoff models or
scaling of upstream or downstream flow measure-
ments, might be appropriate; however, these alter-
nate methods will generally compromise the
accuracy of the LDC.
Step 2: Calculate the Flow Duration Curve (FDC).
The FDC expresses the functional relationship
between the flow rate in the stream, and the per-
centage of time that the flow rate is exceeded.
Derivation of the FDC is commonly done by first
ranking the
N
measured daily flows, where 1 is the
rank of the highest flow and
N
is the rank of the
lowest flow. For any flow with rank
m
, the exceed-
ance percentage can be estimated by the Weibull
formula (Weibull, 1939) as
Classification
Exceedance Percentage (%)
High flows
0-10
Moist conditions
10-40
Mid-range flows
40-60
Dry conditions
60-80
Low flows
80-100
Step 3: Derive the LDC from the FDC.
The LDC is
derived from the flow duration curve (FDC) by
simply multiplying the ordinate of the FDC by
the water-quality standard,
c
std
, of the contaminant
of interest. A typical resulting LDC is shown in
Figure 4.13. Since the product of a flow rate and
c
std
gives the TMDL for that particular flow rate,
then the LDC is simply the TMDL as a function
of the exceedance percentage of the flow rate. In
unusual cases where the water-quality standard,
c
std
, varies with flow condition, this variation is
respected in multiplying the FDC ordinates by the
appropriate
c
std
to determine the LDC. Such
adjustments are typical of suspended-sediment
standards.
m
N
1
100
(4.158)
exceedance percentage =
×
+
The FDC is then obtained by plotting the flow rate
in the stream versus the exceedance percentage,
where the flow rate is usually plotted on a loga-
rithmic scale. A typical FDC is shown in Figure
4.12. The FDC provides a graphical indication of
In cases where water-quality standards are seasonal
(e.g., summer and winter), separate LDCs for each
season are typically more useful than a single LDC for
the entire year.
high
ows
10
4
moist conditions
mid-range
ows
10
3
dry conditions
10
2
low
ows
10
1
0
20
50
90
10
30
40
60
70
80
100
exceedance percentage (%)
Figure 4.12.
Flow duration curve.


Search WWH ::

Custom Search