Environmental Engineering Reference
In-Depth Information
It should be noted that the solubility of TCE is in the
range 1000-1100 mg/L (Appendix B). In parts of the
stream where the TCE concentrations equal or exceed
the solubility, TCE is likely to exist in the nonaqueous
(pure) phase, and probably below the water surface,
since the density of the pure substance (1460 kg/m
3
) is
significantly greater than that of water (998 kg/m
3
).
0.67
0.67
V
d
5.32
0.2
1
k
=
5.32
=
=
1.81
d
−
1
a
1.85
1.85
Taking the smaller value of
k
a
to be conservative
gives
k
a
= 1.76 d
−1
at 20°C. At 24°C,
k
a
is estimated
(using Eq. 4.60) as
T
−
20
24 20
−
−
1
k
T
=
k
20
1.024
=
1.76(1.024)
=
1.94
d
a
a
The mass transfer coefficient,
k
3
, at
T
= 24°C, and
for a wind speed,
V
w
, of 3 m/s, is given by Equation
(4.53) as
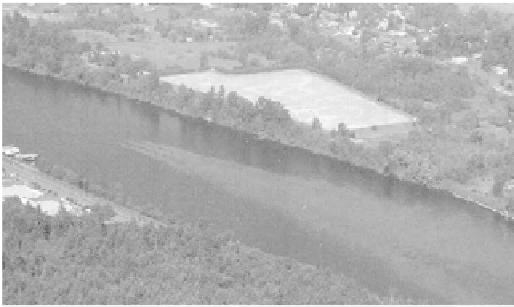
4.4 MODELS OF DISSOLVED OXYGEN
Continuous discharges of contaminant-laden wastewa-
ter into rivers typically occur from domestic wastewater
treatment plants and industrial plants. This is illustrated
in Figure 4.5, which shows the West Linn sewage treat-
ment plant discharging effluent into the Willamette
River (oregon) via a multiport diffuser. The continuous
discharge of wastewaters with high biochemical oxygen
demand (BoD) into streams depletes the Do in the
ambient water and can sometimes cause severe stress
on aquatic life. The instream oxygen demand exerted by
wastewater is partially offset by oxygen transfer from
the atmosphere at the surface of the stream, a process
that is commonly referred to as aeration. The concentra-
tion of Do in natural waters is a primary indicator of
overall water quality and the viability of aquatic habitat.
Design criteria for wastewater discharges generally
require that Do levels on the boundaries of mixing
zones not fall below specified water-quality standards.
Under these circumstances, fate and transport models
of Do can be used to estimate the allowable BoD in
the wastewater discharge so that water-quality stan-
dards are met on the boundary of the mixing zone.
k
=
(416 156
+
V
)
exp
exp
[0.00934(
T
−
26.1)]
3
w
=
(416 156 3)
+
×
[0.00934(
24 26.1)]
−
=
867
m/d
Substituting the values of
d
, Φ,
k
a
,
R
,
T
,
H
, Ψ, and
k
3
into Equation (4.52) gives
−
1
1
1
RT
H k
k
=
+
v
d
Φ
k d
Ψ
a
3
−
1
1
1
1
(0.617)(1.94)(1)
5)
(1014)(0.464)(867)
(8.31)(297.1
=
+
=
1.19
d .
1
The maximum concentration at a distance
x
down-
stream of the spill location is derived from Equation
(4.51) by taking
t
=
x
/
V
, which yields
−
v
/
k x V
Me
c
max
( )
x
=
A
4
π
K x V
L
/
From the data given,
M
= 10 kg,
x
= 5 km = 5000 m,
V
= 0.2 m/s = 17,280 m/d,
A wd
10 1 10 m
2
,
and
K
L
= 1.4 m
2
/s = 120,960 m
2
/d. Hence, at a loca-
tion 5 km downstream of the spill, the maximum
concentration is given by
=
=
(
)( )
=
4.4.1 Oxygen Demand of Wastewater
The oxygen demand of wastewaters is typically
measured by the BoD, and the associated rate of
10
10 4 (120 960)(5000) 17 280
e
−
1.19(5000 17 280)
/
,
c
(5000)
=
max
π
,
/
,
=
=
0.00107
1.07
kg/m
mg/L
3
(b) If volatization is neglected,
k
v
= 0 and
10
10 4 (120 960)(5000) 17280
0.00151
1.51
c
max
(5000)
=
π
,
/
=
=
kg/m
mg/L
3
Therefore, volatization decreases the maximum
concentration by 0.44 mg/L or 29%. Hence, volati-
zation is a significant process.
Figure 4.5.
Discharge of treated domestic wastewater into a
river.
Source
: Citizens for Safe Water (2005).


Search WWH ::

Custom Search