Environmental Engineering Reference
In-Depth Information
Table 1.10. Growth rate of micro-algae measured as number of divisions per day at 25
◦
C
and a light intensity of 5000 respectively 2500 Lux.
Units per cell in Pg/cell*
5000
2500
Dry weight
Chlorella ellipsoidea
0.88
0.85
Chlorella vulgaris
(freshwater)
0.68
0.67
Dunaniella tertiolecta
0.60
0.64
Isochrysis aff. Galbana
0.78
0.81
8-30
Nannochlorois oculata
0.85
0.92
Skeletonema costatum
0.6
0.67
52
Tetraselmus suecica
0.46
0.44
66-292
*1 Pg
=
1000 Tg
=
1000 million tonnes.
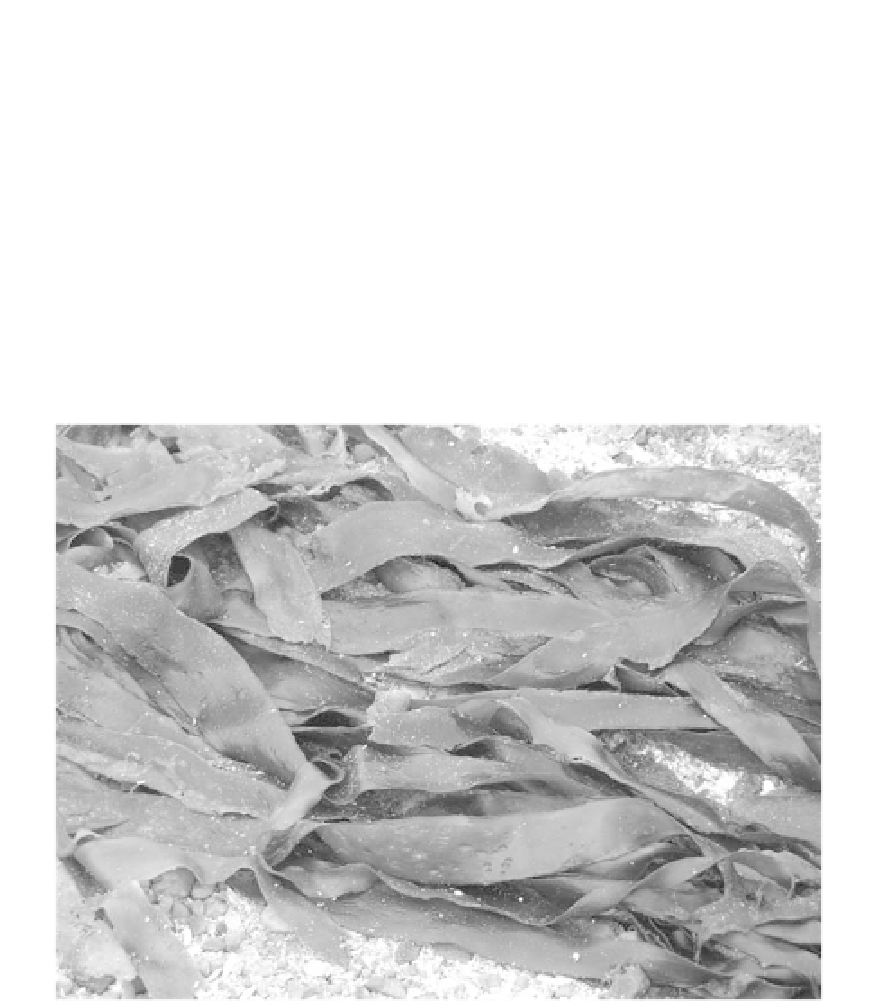
Figure 1.5. Macro algae at Cape Good Hope, South Africa (photo E. Dahlquist).
1.5 REGIONAL OVERVIEWS
The following section some important regions will be addressed a bit more in detail. The overview
is not covering all countries and regions, but represents approximately half of the populations at
earth, and most type of climate zones.
1.5.1
EU27 - an overall energy balance
We have made some calculation of the agricultural and forestry production with respect to bioen-
ergy for EU27 (EU with 27 member countries). The conservative figures (Dahlquist
et al
., 2010)
say around 8500TWh/y, which can be compared to the 16,000TWh/y primary energy used today


Search WWH ::

Custom Search