Environmental Engineering Reference
In-Depth Information
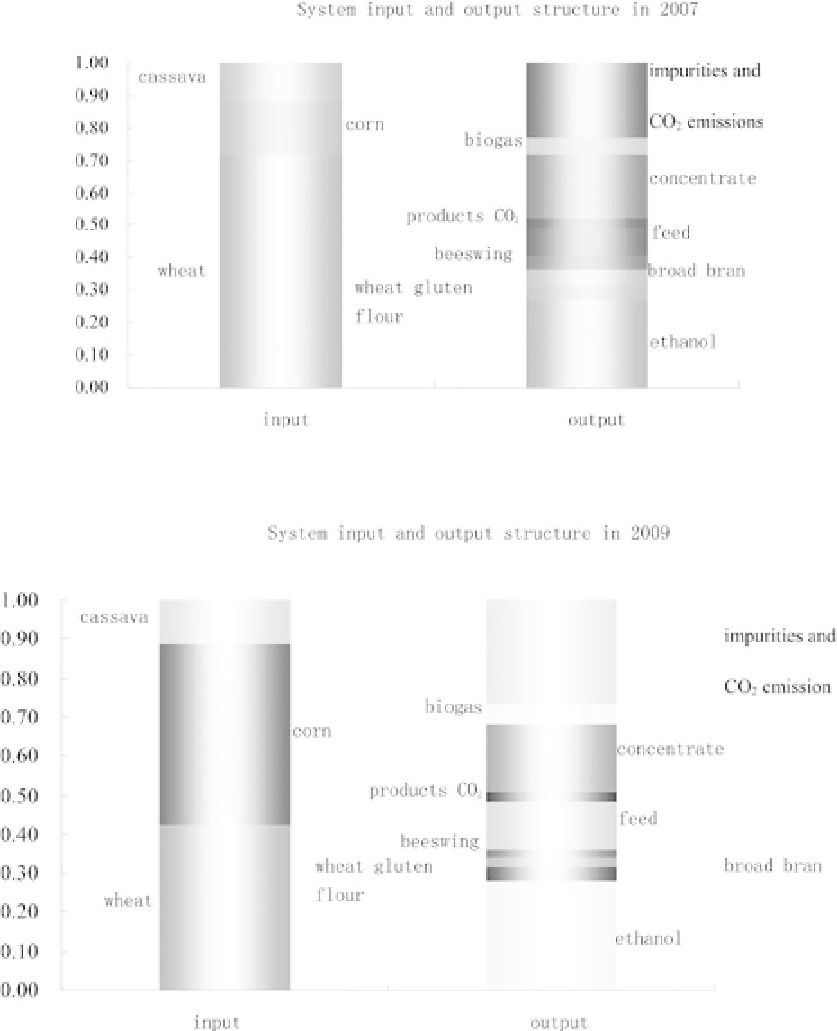
Figure 9.7.
Input and output structure diagram with respect to material flows (in 2007).
Figure 9.8.
Input and output structure diagram with respect to material flows (in 2009).
the raw materials and non-recovery carbon dioxide emissions occupy about 20-30% of the total
amount. It is the increase of impurities and carbon dioxide emissions that causes the year by year
reduction of the total material utilization (production amount/raw material consumption) in the
years 2006, 2007, 2008 and 2009.
9.6.1
Analysis of systems group diversion
We take the year 2007 as an example to analyze two main components: starch and protein. First,
we make a
starch flow system diagram and analysis.
Search WWH ::

Custom Search