Environmental Engineering Reference
In-Depth Information
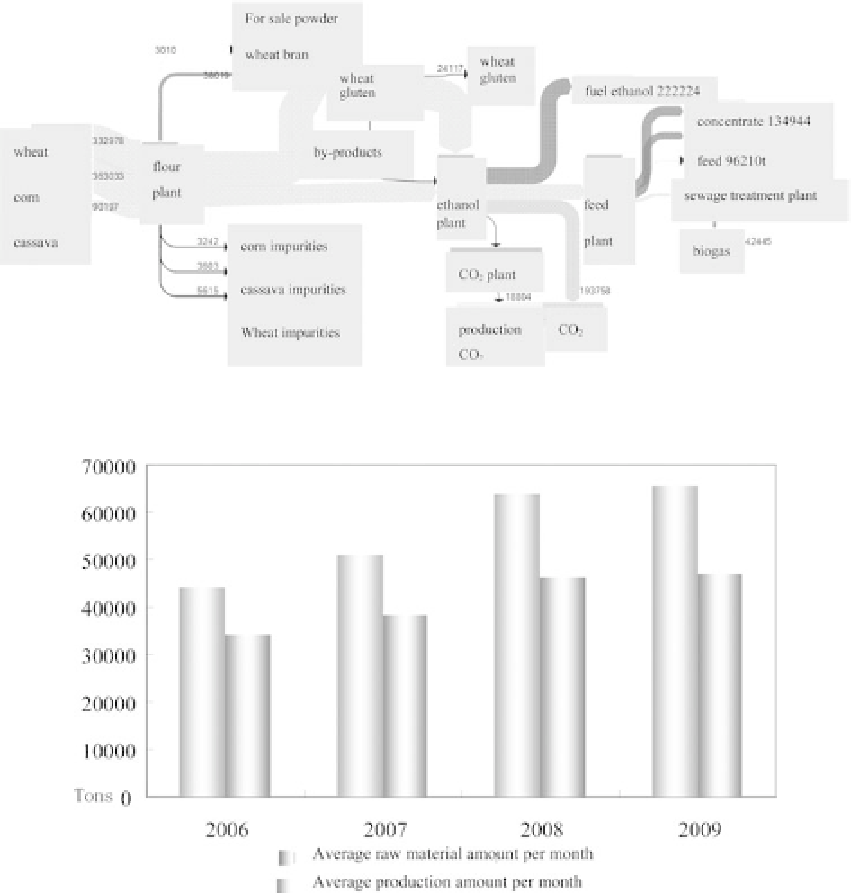
Figure 9.5. General material flow diagrams in the zone (2009 the whole year).
Figure 9.6. Total raw material input and total amount of production in the plant from 2006-2009.
The general material flow of the fuel ethanol in the whole year 2009 is as shown in Figure 9.5.
Compared with 2007, the production system structure in the zone remains the same, but the
production scale has improved significantly.
9.6 GENERAL MATERIAL FLOWANALYSIS
Figure 9.6 shows the total amount of raw material and total production output from 2006 to
2009. The input of raw material that the company uses for production (excluding coal energy
consumption and non-coal process water consumption) is increasing every year. From 2006 to
2009, the rate reached 48%. The corresponding increasing rate of production amount was 37%,
and the average material use efficiency was above 70%.
Figures 9.7 and 9.8 shows the system input and output in 2007 and 2009. Thematerial utilization
of the raw materials for the existing fuel ethanol system has already reached a relatively high
level. Almost all of the useful substances have been put into use, and only the impurities in
Search WWH ::

Custom Search