Environmental Engineering Reference
In-Depth Information
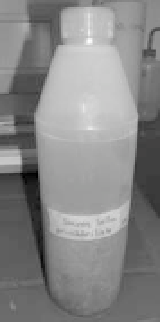
Figure 6.5. Original substrate sample.
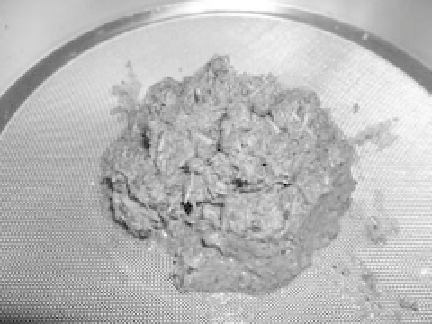
Figure 6.6. Substrate after dewatering.
in the bio char (Sevilla and Fuertes, 2009b). At the same time, there is a reduction in the oxygen
and hydrogen contents. Furthermore, an increase of the temperature gives a reduced content of
oxygen and hydrogen.
6.5.2.3
HTC of a selected biowaste substrate
As an example of the procedure, the HTC of pulp and paper waste sludge will be described.
Figure 6.5 shows the raw material in original shape and Figure 6.6 presents the substrate after
dewatering and preparation for HTC.
After preparation the substrate has been carbonized in a lab batch autoclave with a volume of
approximately 300mL. Figure 6.7 shows the most relevant process parameters within the exper-
iment (two carbonizations were performed, firstly at 200
◦
C autoclave temperature and secondly
at 220
◦
C autoclave temperature) (Krüger, 2011).
In Figures 6.8 and 6.9, a comparison of different substrate and product values is given to describe
the change of certain parameters during the HTC process. Figure 6.10 provides a comparison of
the heating values to lignite and coal-heating values (see corresponding marks). Additionally to
this Figure 6.11 gives a visual impression about the produced biochar after dewatering and drying
in comparison to the dried and dewatered substrate and the carbonization diagram in Figure 6.12
gives information about the quality of the HTC product out of paper waste material.
Finally, flaring tests were performed with the bio-char and the results gave a promising
impression about the suitability concerning energy production (Fig. 6.13).
Search WWH ::

Custom Search