Biomedical Engineering Reference
In-Depth Information
(a)
100
80
60
40
20
0
0
10
20
30
40
50
Mesh size (nm)
(b)
100
80
60
40
20
0
0
0.025
0.05
0.075
0.10
0.125
Probability of C3 insertion at the core surface
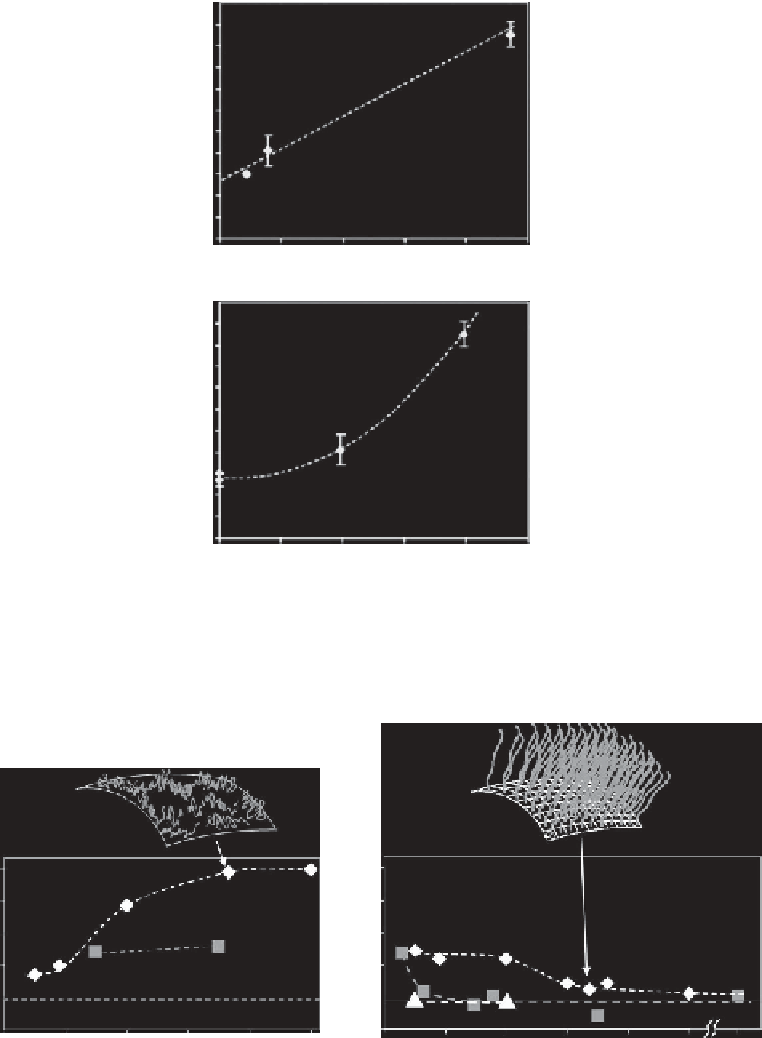
FIGURE 18.6
The relation between complement activation induced by the nanoparticles and the mesh size
of the corona (a) and the insertion probability of the C3 protein at the core surface (b). (Reproduced from
Vauthier, C. et al. 2011.
Biomaterials
. 32:1646-56. With permission.)
(a)
(b)
A1
R1
1.0
1.0
0.8
0.6
0.4
0.2
0.0
0.8
0.6
0.4
0.2
0.0
0
20
40
60
80
100
0
20
40
60
80
100
200
Mw (kDa)
Mw (kDa)
FIGURE 18.7
Complement activation factors (CAF) evaluated for nanoparticles prepared by anionic (a)
and radical polymerization (b) with different polysaccharides (black diamond: dextran, gray squares: chito-
san, black triangle: dextran sulfate) and varying their molecular weight. The basic activation of the comple-
ment system in the experimental conditions is indicated by the horizontal dotted line at a CAF of 0.195. On
the top of the graphs, schemes illustrate the configuration of the polysaccharide chains in the corona of the
nanoparticles according to the mechanism of polymerization applied to prepare the nanoparticles. (CAF val-
ues were taken from Bertholon, I., Vauthier, C., and Labarre, D. 2006a.
Pharm. Res.
23:1313-1323; Model of
the nanoparticle surface from Vauthier, C. et al. 2011.
Biomaterials
. 32:1646-56. With permission.)