Biomedical Engineering Reference
In-Depth Information
(a)
(c)
(e)
100
Bare
Plasma
1 h
6 h
80
X
80
60
60
40
40
20
20
0
0
0.1
0.2
0.3 0.4
Particle diameter (μm)
0.5
0.6
0.7
0.8
75
80
85
90
D (nm)
95
100 05
(d)
(f)
(b)
100
100
1 h
6 h
Bare
Plasma
X
80
80
60
60
40
40
20
20
0
0
0.1
0.3 0.4
Particle diameter (μm)
0.5
0.7
0.2
0.6
0.8
456 789
2345678
1000
100
D
H
(nm)
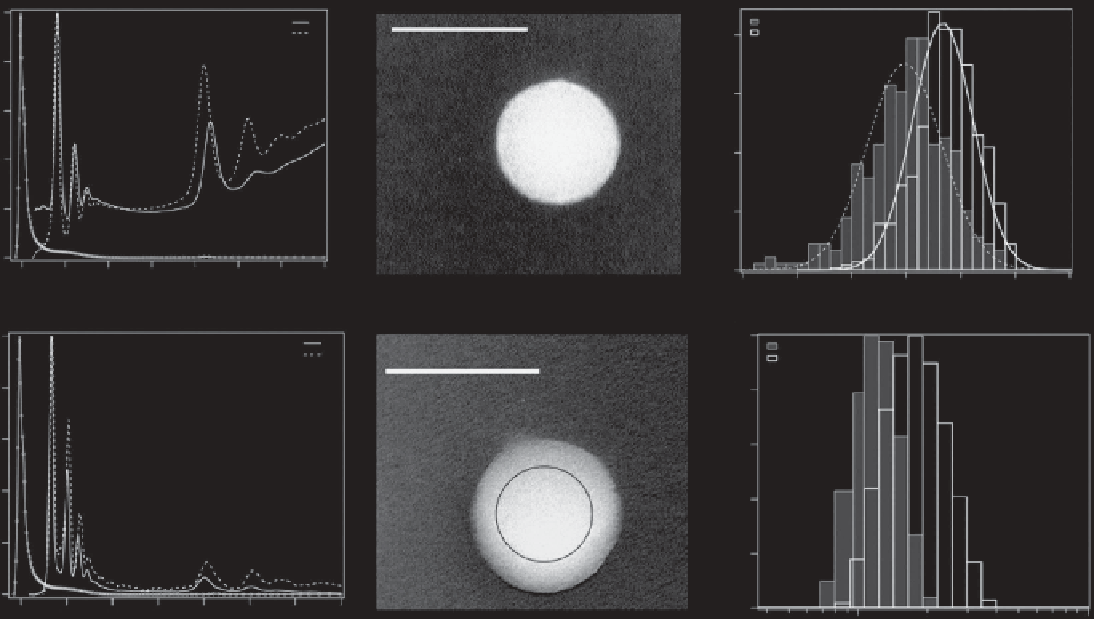
FIGURE 9.5
Formation of protein corona around a spherical nanoparticle. (a) Time-dependent measurements of differential scanning calorimeter for 100 nm
nanoparticle-protein complexes, 1 h (full line) versus 6 h (dotted line) in full plasma; (b) time-dependent measurements of differential scanning calorimeter for 100 nm
nanoparticle-protein complexes, 1 h (full line) versus 6 h (dotted line) without excess plasma; (c) TEM image of nanoparticle, scale bar is 100 nm; (d) TEM image of
protein-nanoparticle complex, scale bar is 100 nm; (e) distribution curve representing the size distribution of different nanoparticle formations based on TEM analysis;
(f) size distribution of 100 nm bare nanoparticles and nanoparticle-protein complexes without excess plasma. (Reproduced with permission from Walczyk D et al. What
the cell “sees” in bionanoscience.
Journal of American Chemical Society
2010;132(16):5761-8.)