Information Technology Reference
In-Depth Information
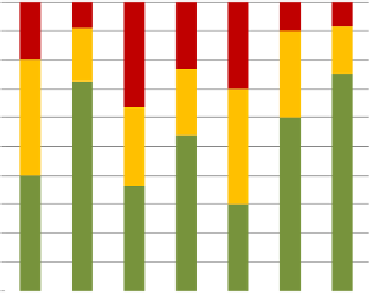
2.7.5 Stacked Bar or Column Graphs
Stacked bar graphs (
Figure 2.15
) are basically multiple pie charts shown in bar
or column form. They're appropriate whenever you have a series of data sets,
each of which represents parts of the whole. Their most common use in user
experience data is to show different task completion states for each task. Here
are some key principles for their use.
•
Likepiecharts,stackedbargraphsareonlyappropriatewhentheparts
for each item in the series add up to 100%.
•
Theitemsintheseriesarenormallycategorical(e.g.,tasks,participants).
Task Completion Status, by Task
100%
90%
80%
70%
60%
50%
Failure
Partial Success
Full Success
40%
30%
20%
10%
0%
100%
90%
80%
70%
60%
Failure-Other Wrong
Failure-Wrong Answer
Almost Success
Success w/Assist
Full Success
50%
40%
30%
20%
10%
0%
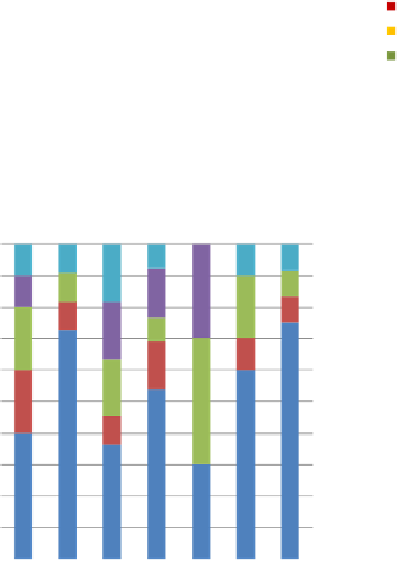
Figure 2.15 Good and bad examples of stacked bar graphs for the same data. Mistakes in the bad
version include too many segments, poor color coding, and failing to label the vertical axis.


Search WWH ::

Custom Search