Information Technology Reference
In-Depth Information
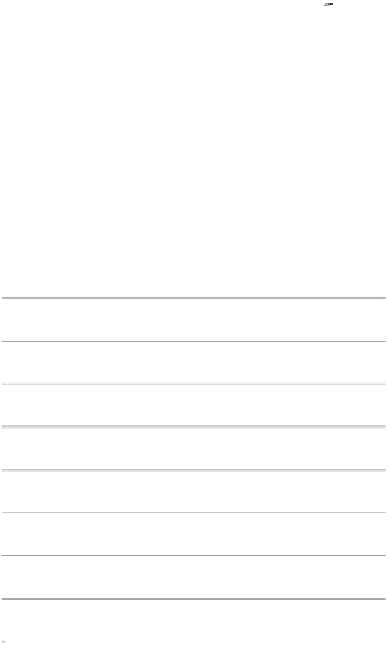
Visual Appeal vs. Size of Largest Image
4.0
3.5
R
2
= 0.56
3.0
2.5
2.0
1.5
1.0
0
50
100
150
200
250
300
350
400
Size of Largest Non-text Image (k-pixels)
4.0
3.5
3.0
2.5
2.0
1.5
1.0
0.5
0.0
0
50
100
150
200
250
300
350
400
Figure 2.13 Good (top) and bad (bottom) examples of scatterplots for the same data. Mistakes in the bad
version include an inappropriate scale for the vertical axis, not showing the scale for visual appeal ratings
(1-4), not showing a trend line, and not showing goodness of fit (
R
2
).
values, the means come close to being continuous. The horizontal axis
shows the size, in k pixels, of the largest nontext image on the page,
which truly is continuous.
•
Youshoulduseappropriatescales.In
Figure 2.13
, the values on the verti-
cal axis can't be any lower than 1.0, so it's appropriate to start the scale at
that point rather than 0.
•
Your purpose in showing a scatterplot is usually to illustrate a rela-
tionship between the two variables. Consequently, it's often helpful to
add a trend line to the scatterplot, as in the good example in
Figure 2.13
. You may want to include the
R
2
value to indicate the good-
ness of fit.


Search WWH ::

Custom Search