Information Technology Reference
In-Depth Information
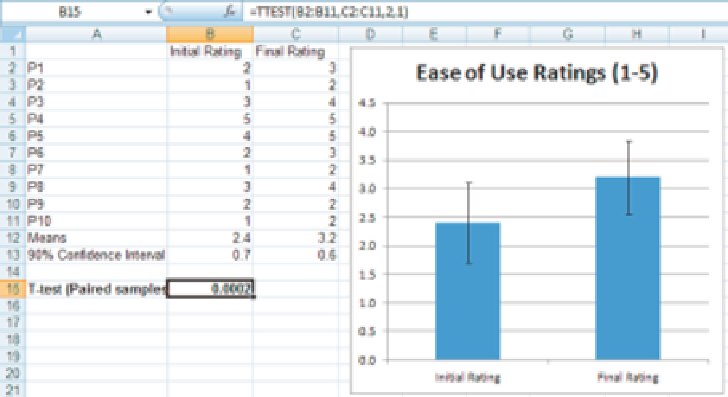
Figure 2.4 Data showing paired samples in which each of 10 participants gave an ease of use rating (on
a 1-5 scale) to an application after an initial task and at the end of the study.
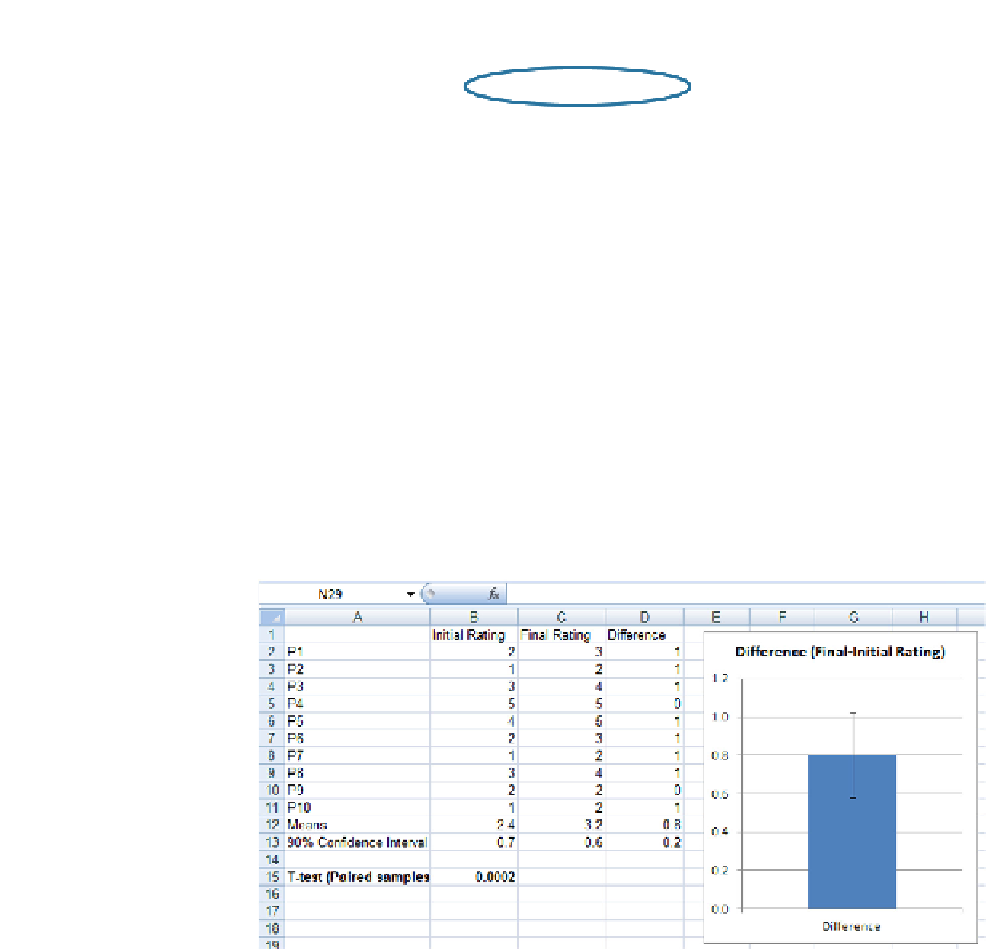
Figure 2.5 Same data as in
Figure 2.4
, but also showing the difference between initial and final ratings,
the mean of those differences, and the 90% confidence interval.
paired-samples test like this, you're basically testing to see if the confidence inter-
val for the mean difference includes 0 or not. If not, the difference is significant.
Note that in a paired samples test, you should have an equal number of val-
ues in each of the two sets of numbers that you're comparing (although it is pos-
sible to have missing data). In the case of independent samples, the number of
values does not need to be equal. You might happen to have more participants
in one group than the other.


Search WWH ::

Custom Search