Information Technology Reference
In-Depth Information
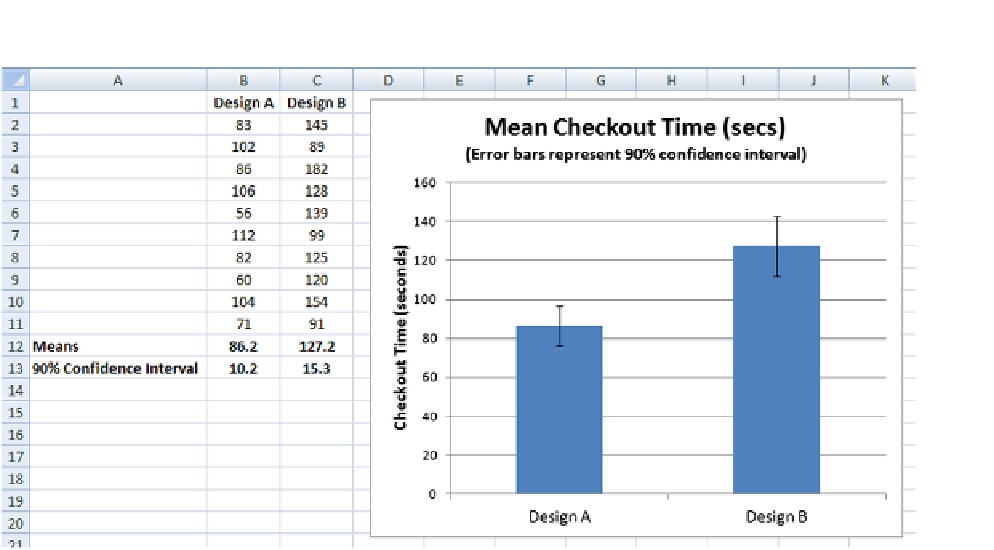
Figure 2.2 Illustration of displaying confidence intervals as error bars on bar graph.
“Specify Value” button. The resulting small window allows you to specify the values for
the positive and negative portions of the error bars, which will both be the same. Click
on the button to specify the Positive Error Value and then select
both
of the values for
the90%conidenceintervalonthespreadsheet(cellsB13andC13in
Figure 2.2
). Then
click on the button for the Negative Error Value and select the exact same cells again.
Close both windows and your error bars should be on the graph.
2.4 COMPARING MEANS
One of the most useful things you can do with interval or ratio data is to com-
pare different means. If you want to know whether one design has higher satis-
faction ratings than another or if the number of errors is higher for one group of
users compared to another, your best approach is through statistics.
There are several ways to compare means, but before jumping into the statis-
tics, you should know the answers to a couple of questions:
1.
Is the comparison
within
the same set of users or
across
different users?
For example, if you are comparing some data for men vs women, it is
highly likely that these are different users. When comparing different
sampleslikethis,it'scalledindependentsamples.Butifyou'recompar-
ing the
same
group of users on different products or designs, you will
use something called paired samples.
Search WWH ::

Custom Search