Information Technology Reference
In-Depth Information
back so a small amount of electrolyte solution (sweat) would be gen-
erated. This sweat was necessary to establish a connection between the
skin surface and the Q Sensor's electrodes.
2. Participants attempted seven tasks (“homework questions”) on the dig-
ital textbook and the paper textbook. Half of the participants conducted
tasks using the digital textbook first, while the other set of participants
used the printed textbook first. The first set of tasks included four tasks
and the second set of tasks included three tasks. Participants were asked
to think aloud as they completed their tasks.
3. After they completed their tasks on either the digital textbook or the
printed textbook, participants used the Product Reaction Cards to indi-
cate their reaction to the experience.
4.
After participants had used both textbooks, we asked a few open-ended
questions about the comparative experience, what they liked best and
least, and which version of the textbook they would prefer if they had
to select one.
10.5.3
Biometric Findings
Q SENSOR DATA RESULTS
For Q Sensor data analysis, we divided Q Sensor data by task. As each participant
was wearing two gloves, we were able to collect two different sets of data for each
task. Of the 140 tasks data points (10 participants with two gloves, across seven
tasks), 102 data points from 9 participants remained after removing poor qual-
ity biometric data and missed tasks.
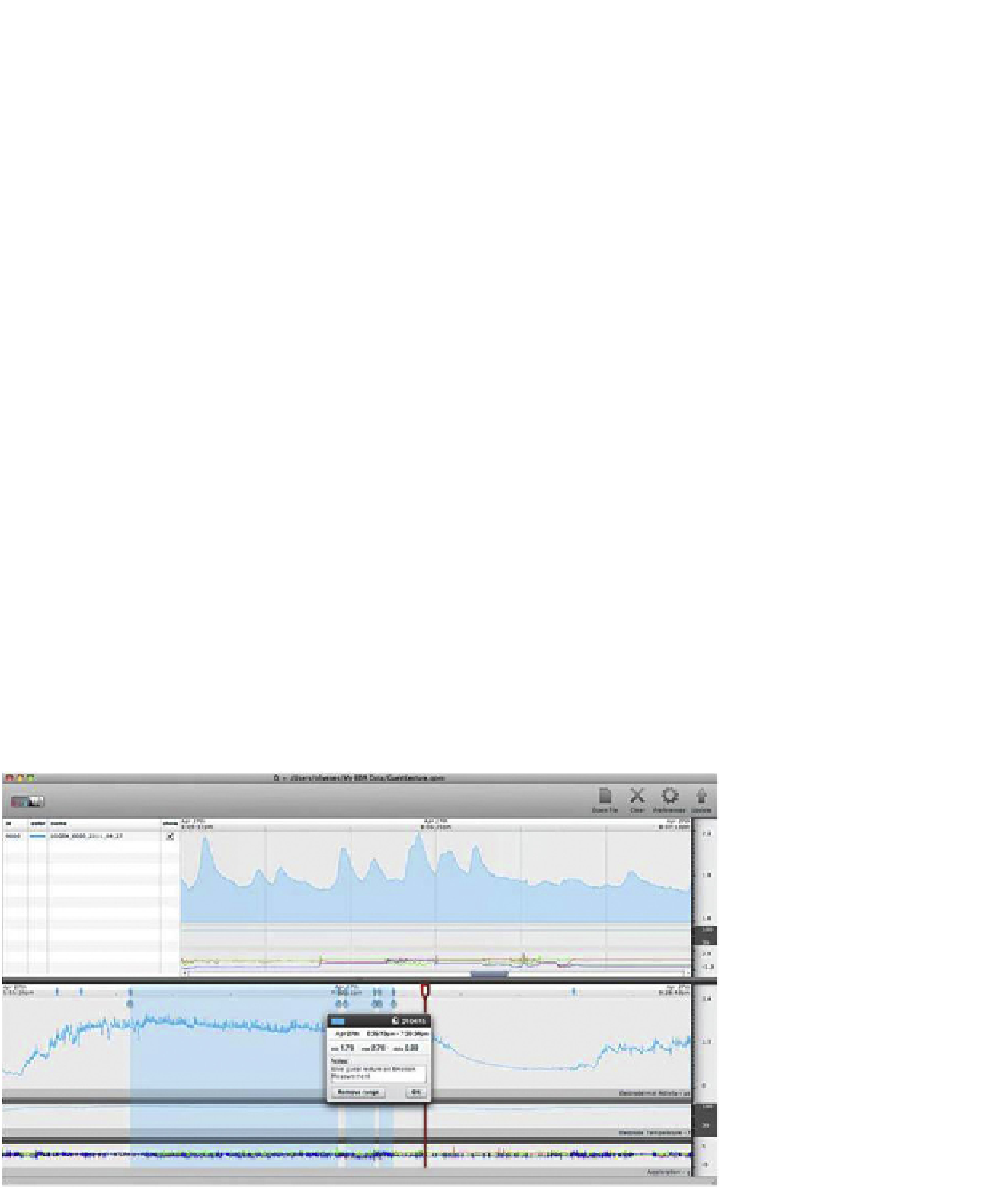
Figure 10.25
provides an example of the Q
Sensor analysis software.
Figure 10.25 Affectiva's analysis software showing a single participant's results from the Q Sensor. The
bottom half screen shows the participant's electrodermal activity during the session, while the top right
zooms in to a particular shorter period of time.
Search WWH ::

Custom Search