Information Technology Reference
In-Depth Information
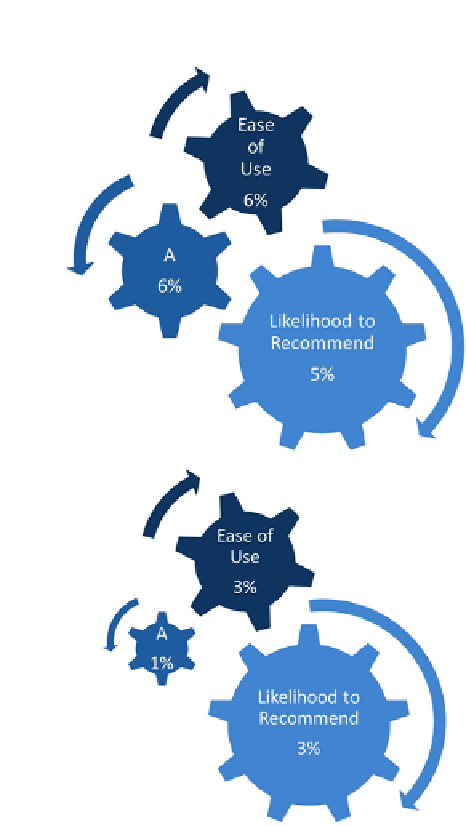
the regression formula: assuming that the other con-
tributing factors remain constant, if we could increase
the satisfaction scores for the overall product ease of
use, for the usability of Feature 1 and for the usability
of Feature 2, then we would see an increase in users'
Likelihood to Recommend of 5%.
In Year 2, we reran the analysis. We found that the
actual increase in Likelihood to Recommend was 3%.
This 3% increase was driven by a 3% increase in ease
of use, a 1% increase in Feature 1's usability, and a
0% increase in Feature 2's usability, as summarized by
Figure 10.3
(right). Regression formulas for the prod-
uct studied are shown here:
Year1 roduct
LTR28 9
=+
.
0
.
−
3
(EaseofUse)
+
0
.
13(Feature1)
+
2
09(Feature2)
.
1
(
R
=
37%
)
Year 2 roduct
−
3
LTR28 9
=+
.
0
.
(EaseofUse)
+
0
.
11(Feature1)
+
2
04(Feature2)
.
2
(
R
=
36
%)
10.1.4
Discussion
Thus, we found that running the multivariate analy-
sis showed that the user experience contributed 36%
to increasing product recommendations. At Year 2,
we hadn't met our target of increasing Likelihood to
Recommend our product by 5%, but by investing in
ease of use and in a few key features we were able to
improve the Likelihood to Recommend by 3%. The
Net Promoter model had provided us with a way to
define and prioritize investment in user experience design and had given us a
way to track the return of that investment year after year.
Figure 10.3 Target Increase in Likelihood to Recommend
(top) vs Actual Increase (bottom).
We wanted to test the Net Promoter model further. Could the model be used
as a predictor of sales growth, as it was originally intended (
Reichheld, 2003
)? We
know the average sales price of our products. We know, from the multivariate anal-
ysis, that interface design contributes 36% to motivating users to recommend our
product. If we knew how many promoters refer the product actively, we could esti-
mate the revenue gains associated with improved user experience of our software.
What we did next is determine if there is a link between “promoters” and
an increase in customer referrals. In our survey, we asked if the respondent—
all were existing customers—had referred the product to a friend in the last
year (
Owen & Brooks, 2008
). From these data we derived the proportion of
Search WWH ::

Custom Search