Information Technology Reference
In-Depth Information
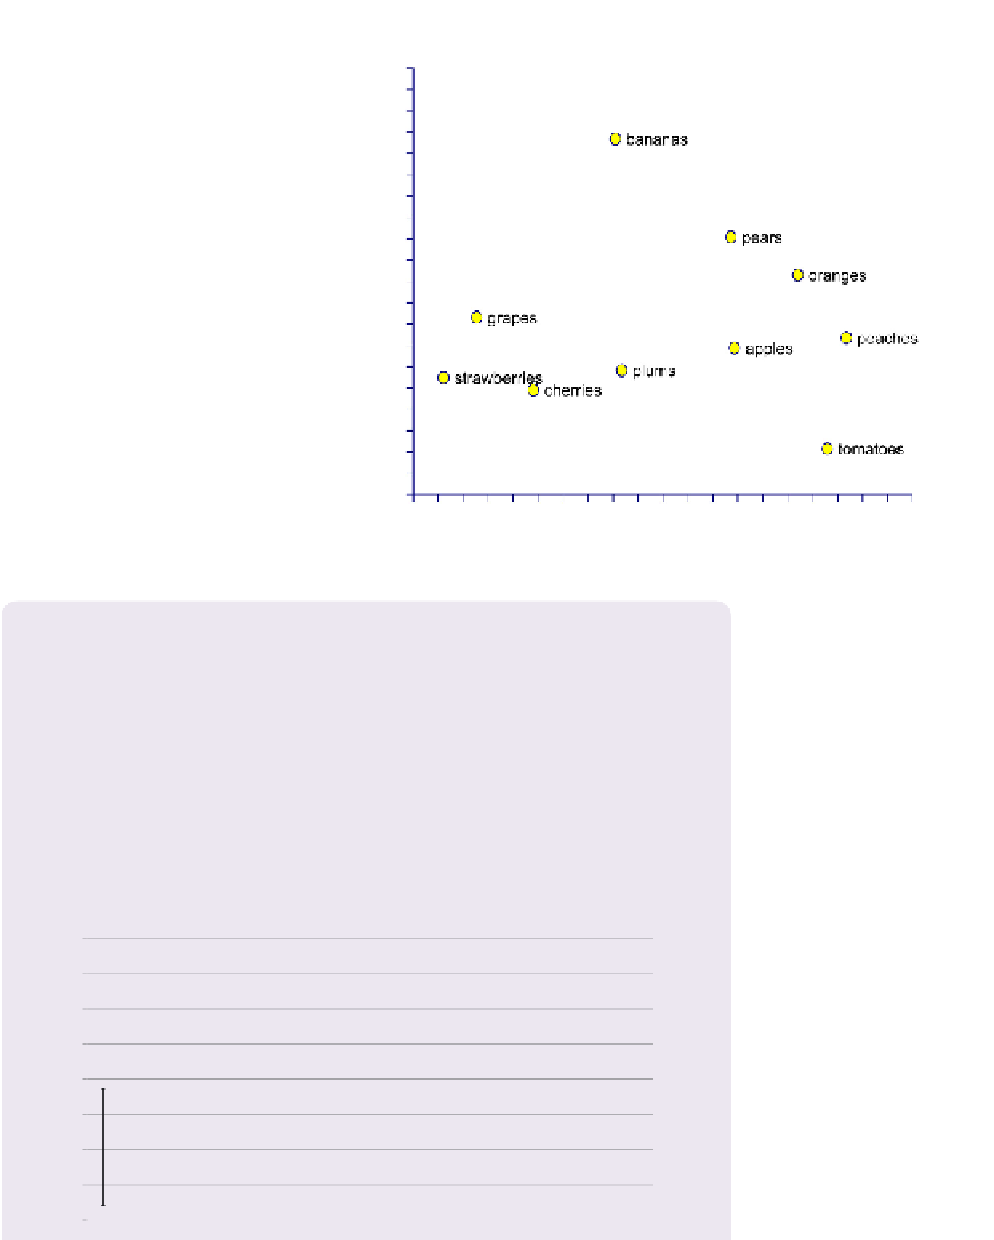
analysis of the data in
Table 9.8
is shown
in
Figure 9.5
. The first thing that's apparent
from this MDS analysis is how the tomatoes
and bananas are isolated from all the other
fruit. That's consistent with the hierarchical
cluster analysis, where those two fruits were
the last two to join all the others. In fact, our
four-cluster “slice” of the hierarchical clus-
ter analysis (
Figure 9.4
) had these two fruits
as groups unto themselves. Another thing
apparent from the MDS analysis is how the
strawberries, grapes, cherries, and plums
cluster together on the left, and the apples,
peaches, pears, and oranges cluster together
on the right. That's also consistent with the
hierarchical cluster analysis.
Note that it's also possible to use more
than two dimensions in an MDS analysis,
but we've rarely seen a case where adding
Figure 9.5 Multidimensional scaling analysis of the distance matrix in
Table 9.8
.
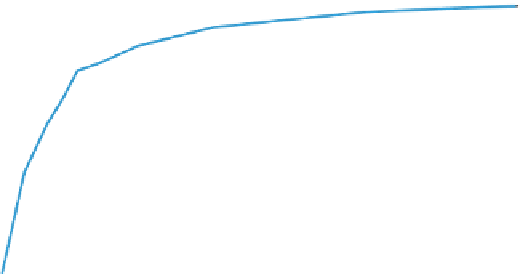
HOW MANY PARTICIPANTS ARE ENOUGH FOR A
CARD-SORTING STUDY?
Tullis and Wood (2004) conducted a card-sorting study in which they addressed the
question of how many people are needed for a card-sorting study if you want reliable
results from your analyses. They did an open sort with 46 cards and 168 participants.
They then analyzed the results for the full data set (168 participants), as well as many
random subsamples of the data from 2 to 70 participants. Correlations of the results for
those subsamples to the full data set looked like the chart here.
Average Correlation as a Function of Sample Size
1.0
1.0
0.9
0.9
0.8
0.8
0.7
0.7
0.6
0.6
0.5
0
5
10
15
20
25
30
35
40
45
50
55
60
65
70
75


Search WWH ::

Custom Search