Information Technology Reference
In-Depth Information
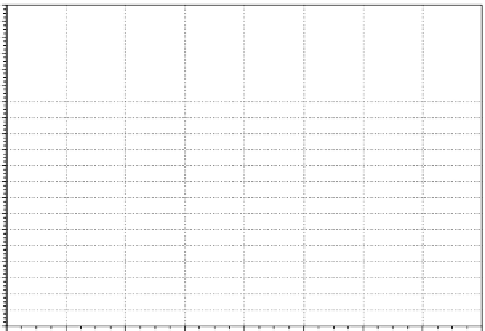
seconds relative to the last few seconds. Conversely, AOI 2 (gray) received more
visual attention in the last few seconds compared to the first few seconds. This is a
useful way to see the relative prominence of each AOI, not just expressed as a total
amount of time.
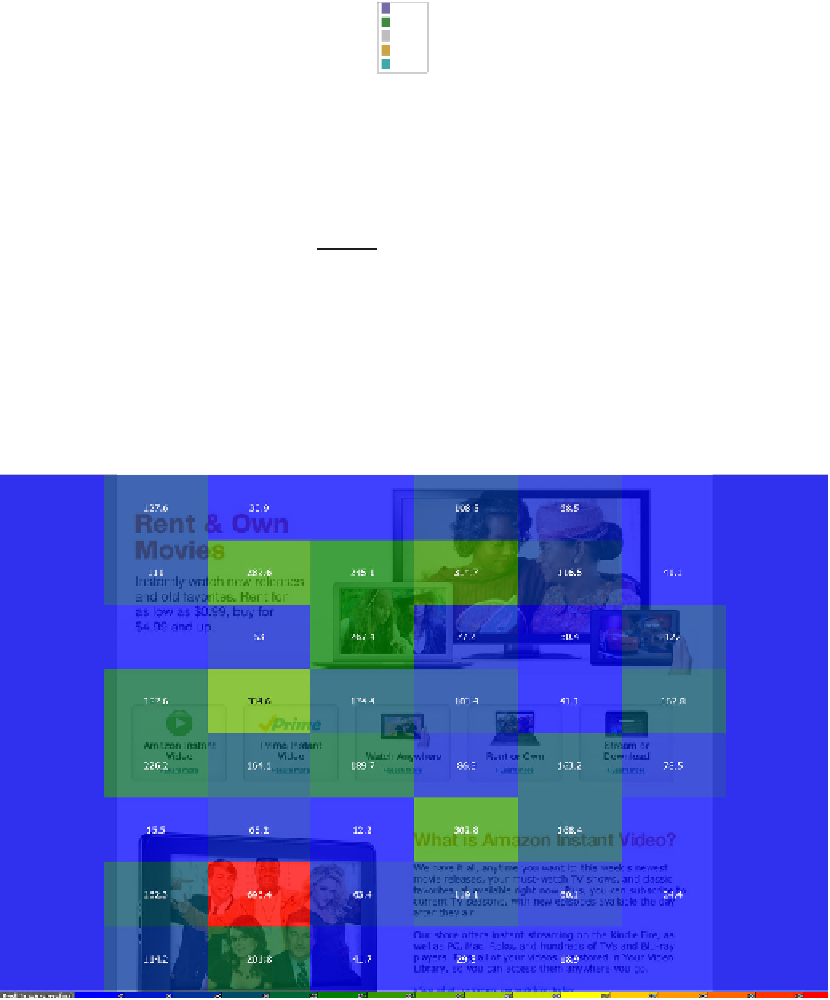
Figure 7.10
is a gridded
AOI that shows the amount of visual
attention given to equal-sized cells. This
is a helpful visualization to see the visual
attention across a page, particularly when
the elements are not consistent across all
pages. For example, the researcher may
choose to aggregate data from more than
one web page into a single gridded AOI
to see generally where users are looking.
100
95
90
85
80
75
70
65
60
55
50
45
40
35
30
25
20
15
10
5
0
AOI 3
AOI 1
AOI 5
AOI 4
AOI 2
7.2.4 Common Eye-Tracking
Metrics
There are many metrics associated with
eye-tracking data. The following are
some of the most common eye-track-
ing metrics used by UX researchers. It's
important that all of these metrics are
0
1
2
3
4
5
6
7
8
Time [s]
Figure 7.9 Example of a binning chart of the same Amazon Movies website.
The binning chart shows the percentage of time spent looking at each AOI
during each 1-second interval.
Figure 7.10 Example of a gridded AOI for the Amazon Movies website. The gridded AOI shows the amount of visual
attention given to equal-sized cells on the page.


Search WWH ::

Custom Search