Information Technology Reference
In-Depth Information
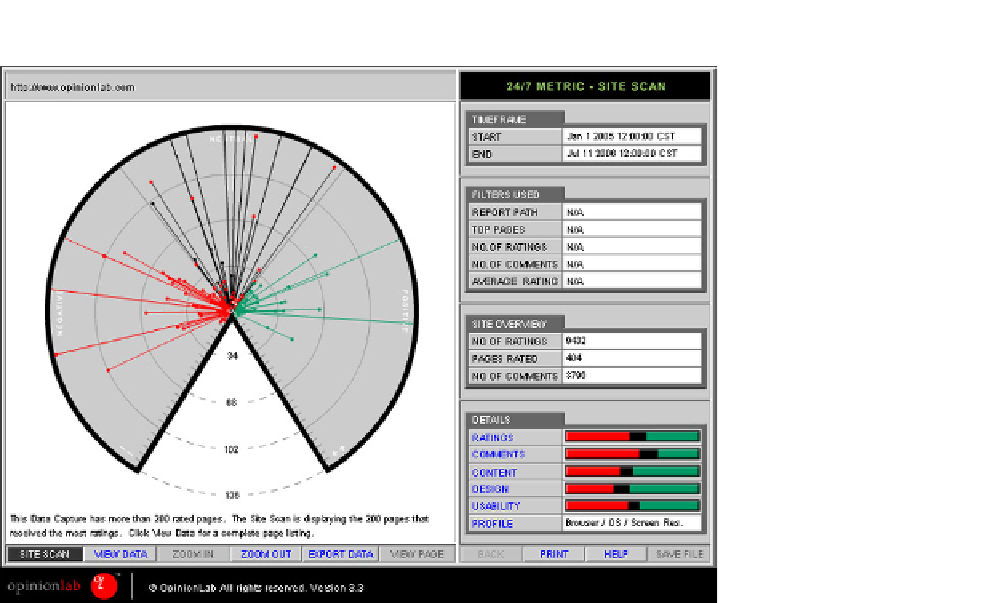
Figure 6.21 OpinionLab provides a variety of techniques for visualizing data for a website. In the
visualization shown here, the most-rated 200 pages are represented graphically on the left. Pages
receiving the most negative ratings are on the left, those with neutral ratings at the top, and those with
the most positive ratings on the right.
OpinionLab keep the number of questions to a minimum. You need
to try to strike a balance between getting the information you need and
“scaring off” potential respondents. With every question you consider
adding, ask yourself if you absolutely must have the information. Some
researchers believe that about 20 is the maximum number of questions
you should ask in this type of survey.
•
Self-selection of respondents
. Because respondents make a decision about
whether or not to complete the survey, they are self-selecting. You should
ask yourself if this biases the responses in any way. Some researchers
argue that people who are unhappy with the website are more likely to
respond than those who are happy (or at least satisfied). If your main
purpose is to uncover areas of the site to improve, that may not be a
problem.
•
Number of respondents
. Many of these services work on the basis of a per-
centage of visitors to offer the survey to. Depending on the amount of
traffic your site gets, this percentage could be quite small and still gener-
ate a large number of responses. You should monitor responses closely
to see if you need to increase or decrease the percentage.
Search WWH ::

Custom Search