Information Technology Reference
In-Depth Information
But what about the smaller sample sizes more typical of usability tests? To
answer that question, we did a subsampling analysis looking at large numbers
of random samples of different sizes taken from the full data set. The results of
this are shown in
Figure 6.7
, where the correlation between the data from the
subsamples and the full data set is shown for each subsample size.
Correlation of Subjective Rating with Full
Dataset at Subsample Sizes
1.00
0.95
0.90
1: Easy/Difficult Task
2: Easy/Difficult Site
3: ASQ Variant
4: Experience
5: 100-pt Scale
0.85
0.80
0.75
0.70
0.65
357911 13 15 17 19 21 23 25 27 29
Subsample Size
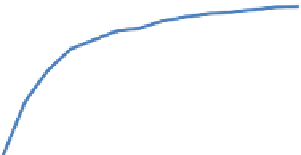
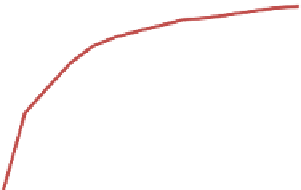
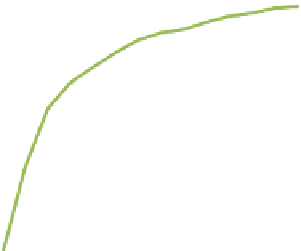
Figure 6.7 Results of a subsampling analysis showing average correlations between ratings for the six
tasks from subsamples of various sizes and the full data set for each condition. Error bars represent the
95% confidence interval for the mean. Adapted from Tedesco and Tullis (2006); used with permission.
The key finding was that one of the five conditions, Condition 1 resulted in
better correlations starting at the smallest sample sizes and continuing. Even at
a sample size of only seven, which is typical of many usability tests, its corre-
lation with the full data set averaged 0.91, which was significantly higher than
any of the other conditions. So Condition 1, which was the simplest rating scale
(“Overall, this task was Very Difficult…Very Easy”), was also the most reliable at
smaller sample sizes.
RATINGS DURING A TASK?
At least one study (Teague et al., 2001) indicated that you might get a more accurate
measure of the user's experience with a task by asking for ratings
during
the conduct of
the task. They found that participants' ratings of ease of use were significantly higher
after the task was competed than during the task. It could be that task success changes
participants' perception of how difficult the task was to complete.


Search WWH ::

Custom Search