Information Technology Reference
In-Depth Information
Mean Subjective Rating by Task
(Error bars represent the 95% confidence interval)
100%
95%
90%
85%
80%
75%
70%
65%
60%
55%
50%
Task 1
Task 2 ask 3
Task 4
Task 5
Task 6
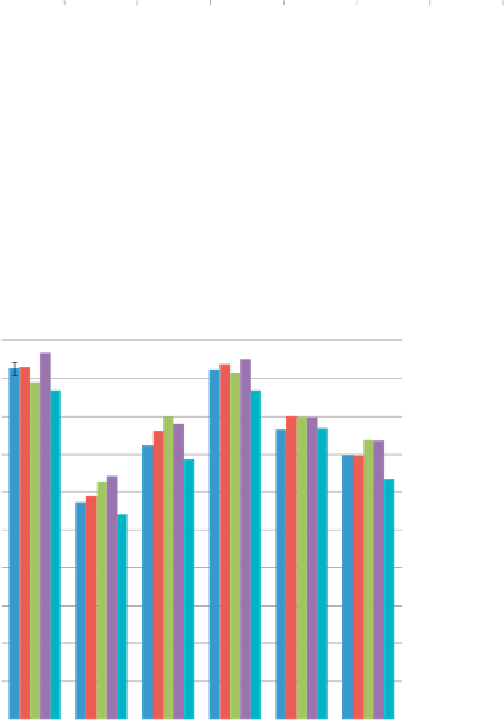
Figure 6.5 Average subjective ratings across all techniques. Ratings are all expressed as a percentage of
the maximum possible rating. Similar to the performance data, Task 2 yielded the worst ratings, whereas
Task 4 yielded among the best. Adapted from Tedesco and Tullis (2006); used with permission.
Figure 6.6
shows the averages of task ratings for each of the tasks, split out
by condition. The key finding is that the pattern of the results was very similar
regardless of which technique was used. This is not surprising, given the very
large sample (total
N
of 1131). In other words, at large sample sizes, all five of
the techniques can effectively distinguish between the tasks.
Subjective Ratings by Task for All Condition
(Error bars represent the 95% confidence interval)
100%
90%
80%
70%
1: Easy/Difficult Ta sk
2: Easy/Difficult Site
3: ASQ Variant
4: Experience
5: 100-pt Scale
60%
50%
40%
30%
20%
10%
0%
Task 1 ask 2 ask 3 ask 4 ask 5 ask 6
Figure 6.6 Average subjective ratings split by task and condition. All five conditions (self-report
techniques) yielded essentially the same pattern of results for the six tasks. Adapted from Tedesco and
Tullis (2006); used with permission.


Search WWH ::

Custom Search