Information Technology Reference
In-Depth Information
6.3.2 After-Scenario Questionnaire (ASQ)
Jim Lewis (1991) developed a set of three rating scales—the After-Scenario
Questionnaire—designed to be used after the user completes a set of related
tasks or a scenario:
1. “I am satisfied with the ease of completing the tasks in this scenario.”
2. “I am satisfied with the amount of time it took to complete the tasks in
this scenario.”
3. “I am satisfied with the support information (online help, messages,
documentation) when completing the tasks.”
Each of these statements is accompanied by a seven-point rating scale of
“Strongly Disagree” to “Strongly Agree.” Note that these questions in the ASQ
touch upon three fundamental areas of usability: effectiveness (question 1), effi-
ciency (question 2), and satisfaction (all three).
6.3.3 Expectation Measure
Albert and Dixon (2003) proposed a different approach to assessing users' subjec-
tive reactions to each task. Specifically, they argued that the most important thing
about each task is how easy or difficult it was
in comparison to
how easy or diffi-
cult the user
thought
it was going to be. So before the users actually did any of the
tasks, they asked them to rate how easy/difficult they
expect
each of the tasks to be,
based simply on their understanding of the tasks and the type of product. Users
expect some tasks to be easier than others. For example, getting the current quote
on a stock should be easier
than rebalancing an entire
portfolio. Then, after per-
forming each task, the users
were asked to rate how
easy/difficult the task
actu-
ally was
. The “before” rating
is called the
expectation
rat-
ing, and the “after” rating is
called the
experience
rating.
They used the same seven-
point rating scales (1 = Very
Difficult, 7 = Very Easy) for
both ratings. For each task
you can then calculate an
average
expectation rating
and an average
experience
rating
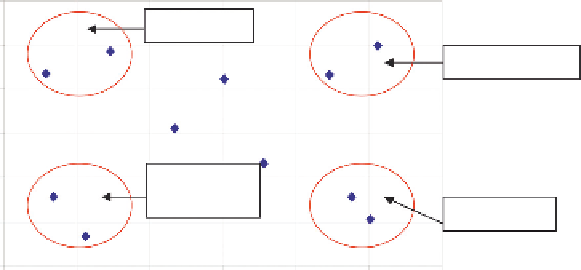
. You can then visu-
alize these two scores for
each task as a scatterplot, as
shown in
Figure 6.3
.
Average Expectation and Experience Ratings
by Ta sk
7
“Promote It”
6
“Don't Touch It”
5
4
3
“Big
Opportunity”
“Fix it Fast”
2
1
1
2
3
4
5
6
7
Very
Difficult
Average Expectation Rating
Very
Easy
Figure 6.3 Comparison of average expectation ratings and average experience ratings for
a set of tasks in a usability test. Which quadrants the tasks fall into can help you prioritize
which tasks to focus on improving. Adapted from Albert and Dixon (2003); used with
permission.

Search WWH ::

Custom Search