Information Technology Reference
In-Depth Information
Top-Box Scores
Obama Site
McCain Site
Top-2-Box Scores
Obama Site
McCain Site
90%
100%
90%
80%
80%
70%
70%
60%
60%
50%
50%
40%
40%
30%
30%
20%
20%
10%
10%
0%
0%
Task 1 ask 2 ask 3 ask 4
Task 1 ask 2 ask 3 ask 4
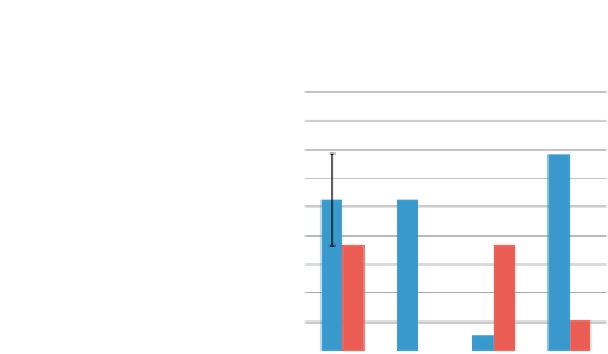
Mean Task Ease Ratings (1-5, Higher=Better)
6.0
Obama Site
McCain Site
5.0
4.0
3.0
2.0
1.0
0.0
Ta sk 1
ask 2
ask 3
ask 4
Figure 6.2 Three different analyses of task ease ratings from a study of the Obama and McCain websites
(Tullis, 2008): mean ratings, top-2-box scores, and top-box scores. Note how similar patterns are revealed
in all three analysis methods, but the apparent disparity between the two sites differs. In each chart, error
bars represent a 90% confidence interval.
All three charts seem to indicate that the Obama site got a higher rat-
ing than the McCain site for three tasks (Tasks 1, 2, and 4), while the McCain
site got a higher rating than the Obama site for one task (Task 3). However,
the apparent disparity between the two sites differs depending on the analy-
sis method. There tends to be a greater difference between the two sites with
the top-box and top-2-box scores compared to the means. (And no, that's not
an error in the top-box and top-2-box charts for Task 2.
None
of the partici-
pants gave that task a top-box or top-2-box rating for the McCain site.) But also
note that the error bars tend to be larger with the top-box and top-2-box scores
compared to the means.
Should you analyze rating scales using means or top-box scores? In practice,
we generally use means because they take all data into account (not ignoring
some ratings as in top-box or top-2-box analyses). But because some companies
or senior executives are more familiar with top-box scores (often from market


Search WWH ::

Custom Search