Information Technology Reference
In-Depth Information
•
Istheusabilityimprovingwitheachdesigniteration?Focusonthisques-
tion when you need to know how the usability is changing with each
new design iteration.
•
Whereshouldyoufocusyoureffortstoimprovethedesign?Theanswer
to this question is useful when you need to decide where to focus your
resources.
All of the analyses we examine can be done with or without severity ratings.
Severity ratings simply add a way to filter the issues. Sometimes it's helpful to
focus on the high-severity issues. Other times it might make more sense to treat
all the usability issues equally.
5.4.1 Frequency of Unique Issues
The simplest way to measure usability issues is to simply count the unique
issues. Analyzing the frequency of unique issues is most useful in an iterative
design process when you want some high-level data about how the usability is
changing with each new design iteration. For example, you might observe that
the number of unique issues decreased from 24 to 12 to 4 through the first three
design iterations. These data are obviously trending in the right direction, but
they're not necessarily iron-clad evidence that the design is significantly bet-
ter.Perhapsthefourremainingissuesaresomuchbiggerthanalltherestthat
without addressing them, everything else is unimportant. Therefore, we suggest
a thorough analysis and explanation of the issues when presenting this type of
data.
Keepinmindthatthisfrequencyrepresentsthenumberof
unique issues
, not
the
total number of issues
encountered by all participants. For example, assume
Participant A encountered 10 issues, whereas Participant B encountered 14
issues,but6ofthoseissueswerethesameasthosefromParticipantA.IfAand
Bweretheonlyparticipants,thetotalnumberofuniqueissueswouldbe18.
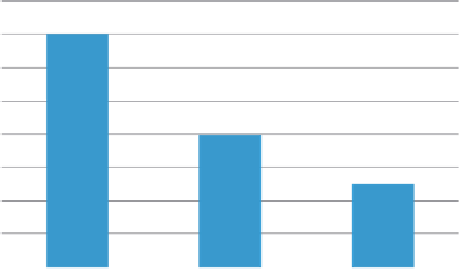
Figure 5.2
shows an example of how to present the frequency of usability issues
when comparing more than one design.
The same type of analysis can be per-
formed using usability issues that have
been assigned a severity rating. For exam-
ple, if you have classified your usability
issues into three levels (low, medium,
and high severity), you can easily look
at the number of issues by each type of
severity rating. Certainly the most tell-
ing data item would be the change in
the number of high-priority issues with
each design iteration. Looking at the fre-
quency of usability issues by severity rat-
ing, as illustrated in
Figure 5.3
, can be
very informative since it is an indicator of
16
14
12
10
8
6
4
2
0
Design 1
Design 2
Design 3
Figure 5.2 Example data showing the number of unique usability issues by
design iteration.


Search WWH ::

Custom Search