Database Reference
In-Depth Information
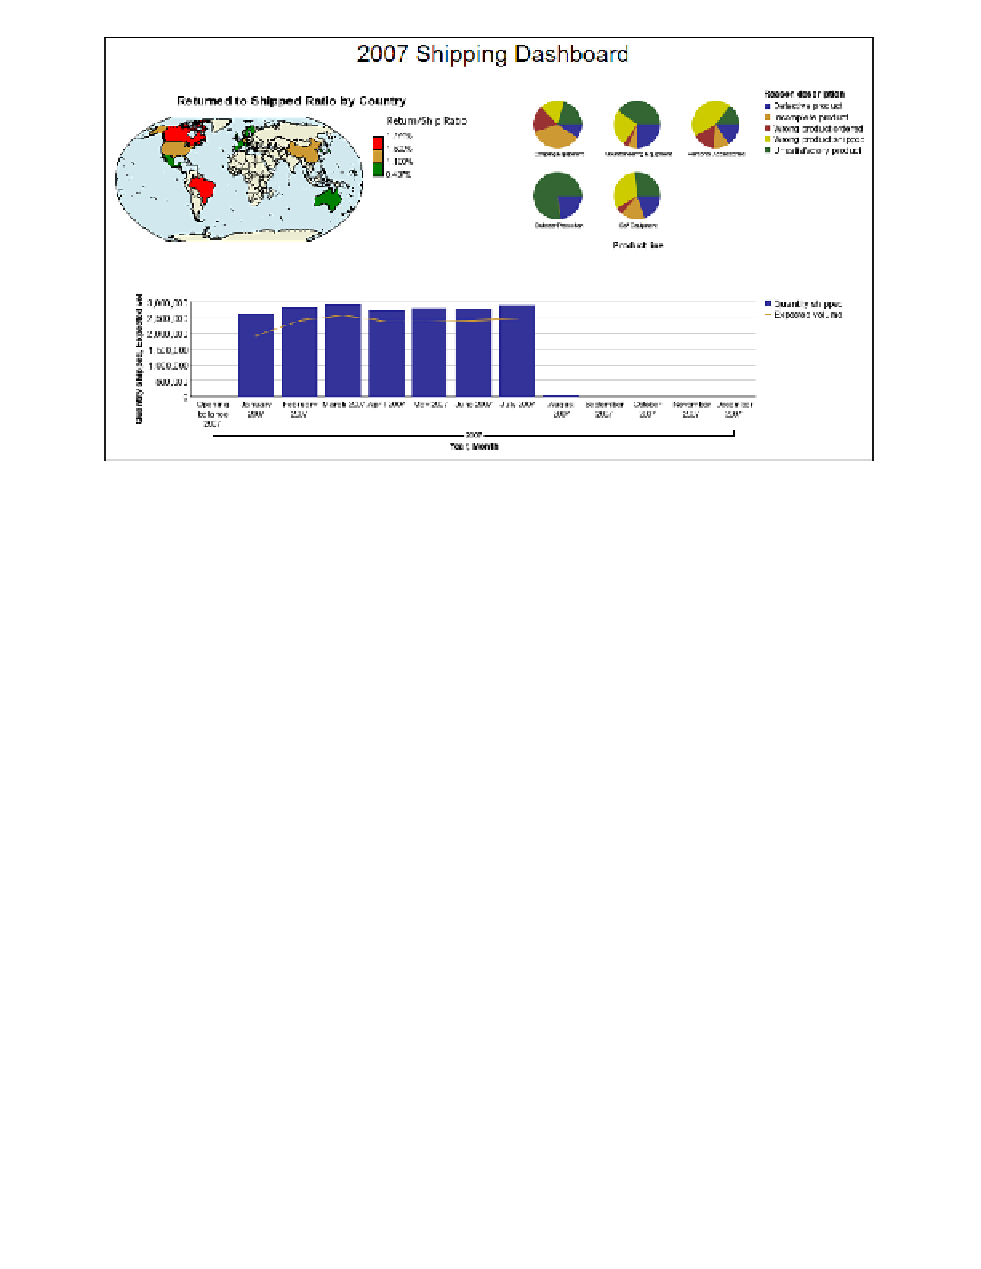
Figure 2.9
Completed map
Step 10: Format the Pie Chart
The pie chart should have the legend in a different position to take advantage of the whitespace in
the region, and the text in the chart needs to change to make it easier to read.
1.
In the work area, click the
Legend
object in the pie chart to select it.
With five different product lines, the legend can be displayed explicitly in the place of a
sixth pie chart.
2.
In the
Properties
pane, change the
Absolute Position
property to
Ye s
.
3.
Change the
Right Position (px)
property to
450
.
NOTE
The right position needs to change before the left position or you will receive an
error stating that the left position needs to be less than the right position.
4.
Change the
Left Position (px)
property to
300
.
5.
Change the
To p Po s i t i o n ( p x )
property to
100
.
6.
In the
Properties
pane, click
Select Ancestor
.
7.
Choose
Pie Chart
to select the object.
8.
Set the
Title
property to
Show
.
9.
Set the
Axis title
property to
Hide
.