Database Reference
In-Depth Information
17.
From the
Data Items
tab of the
Insertable Objects
pane, drag the following items into
the statistics container:
•
Gross profit
into
Analysis variable
•
Campaigns Only
into
Grouping variable
•
Order number
into
Cases variable
18.
From the
Run
menu, select
Run Report - HTML
to compare the dashboard to what's
shown in Figure 6.50. When prompted, select members
2004
,
Camping Equipment
,
and
Asia Pacific
, along with the Box Plot Chart.
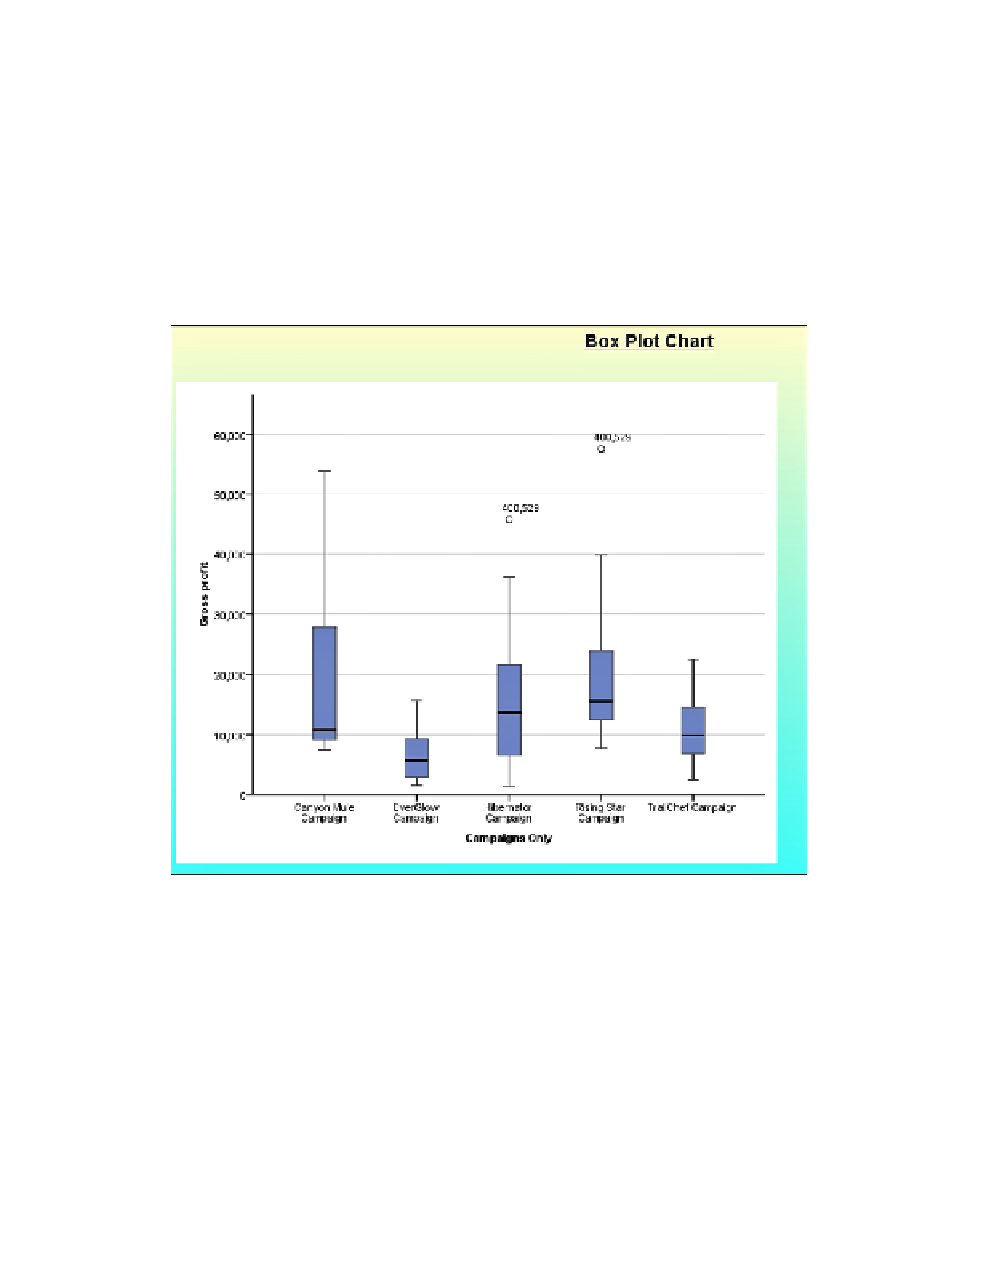
Figure 6.50
Completed Box Plot Chart report page
This report shows that order number 400529 was a significantly large order in which the
retailer used items from two different campaigns in the order.
19.
Close
IBM Cognos Viewer
to return to your query design.