Database Reference
In-Depth Information
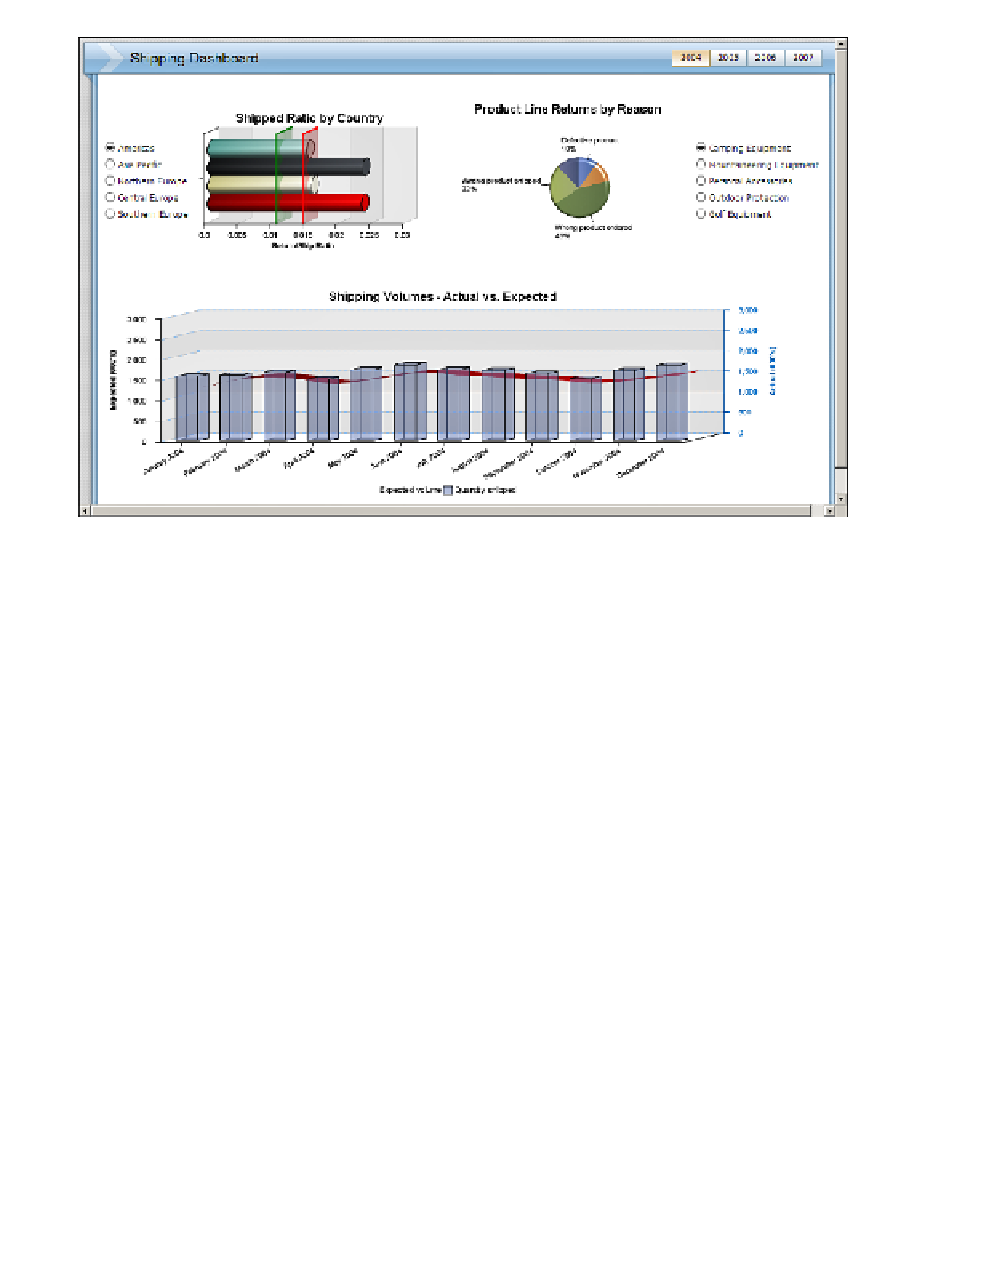
Figure 6.39
Final dashboard view
The sales and marketing team wants to take a look at how the promotions are performing. They want
to be able to see the promotional profits against the regular profits for the same period. To do this, we
will take advantage of a new add-on to the IBM Cognos Report Studio tool called IBM Cognos Sta-
tistics. This is an additional feature that might not be available in your individual environment.
Continuing the evaluation, the staff wants to see how the promotions did statistically. Did
the promotions really bring in more profit than would have been made if the promotions did not
happen? The staff wants to see a quick comparison of statistic measures, an analysis of the vari-
ance between the means, and a chart of exceptional orders for each of the promotions, and see
whether the order method affects promotional and regular profits.
The statistics report will prompt the user for different dimensions and a choice of analysis.
Figure 6.40 shows the completed prompt page.
One of the statistical analyses should look like Figure 6.41.
The initial report will contain pages for each of the statistics functions using the new Statistics
data container. Each page will have code added to the report to open the browser window to a spe-
cific size. The page will be displayed only if requested through a prompt.