Database Reference
In-Depth Information
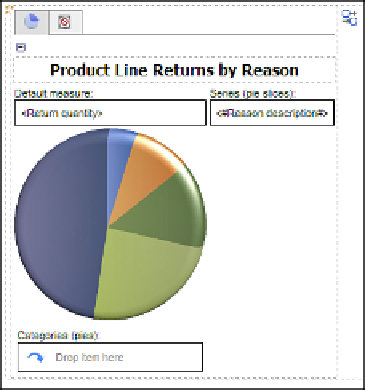
Figure 6.37
Pie chart design
8.
Double-click on the
Padding
property.
The Padding dialog box opens.
9.
Add
20
pixels of padding on the top.
10.
Click
OK
to close the Padding dialog box.
11.
Double-click on the
Size & Overflow
property.
The Size & Overflow dialog box opens.
12.
Set the
Height
to
300
pixels and the
Width
to
900
pixels.
13.
Click
OK
to close the dialog box.
14.
Expand the
Axis titles
area within the chart.
15.
Click on the first
Axis title
to select it (this is the x-axis).
16.
In the
Properties
pane, change the
Default Title
property from
Ye s
to
No
.
17.
Click on the second
Axis title
to select it (this is the left y-axis).
18.
In the
Properties
pane, change the
Default Title
property from
Ye s
to
No
.
19.
Double-click on the
Axis title text
that you just enabled.
The Text box opens.
20.
Type the following text:
Expected (000's)
.
21.
Click
OK
.
22.
Click on the third
Axis title
to select it (this is the right y-axis).
23.
In the
Properties
pane, change the
Default Title
property from
Ye s
to
No
.