Database Reference
In-Depth Information
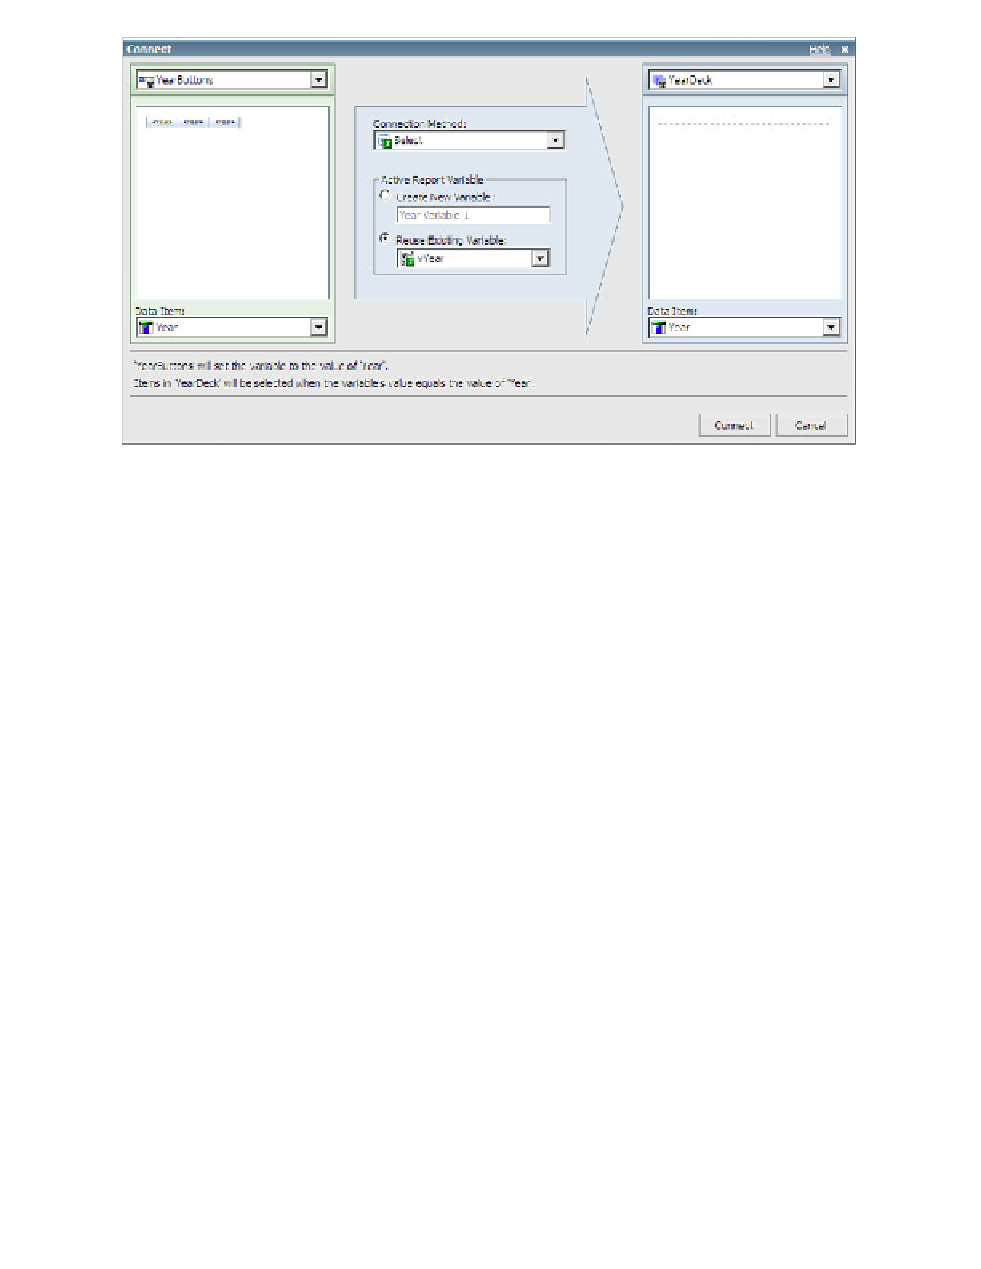
Figure 6.22
Third Connect dialog box
13.
Click on the
Connect
button in the lower-right area of the dialog box.
We have completed the connections between the YearButtons button and the three data
decks that will contain chart objects. There are two more connections left to complete
between the radio-button bars and the data decks.
14.
In the Interactive Behavior dialog box, click on the drop-down menu under the
Control
heading at the top of the dialog box and change the selection to
BranchRegionButtons
.
15.
Click on the
Create a New Connection
link in the lower-left corner of the dialog box.
A new Connect dialog box opens.
16.
In the middle of the dialog box, change the name of the new variable that will be created
from
Branch region Variable 1
to
vRegion
.
17.
In the upper-right corner of the dialog box, click on the drop-down menu and select the
RegionYearDeck
.
Yo u r f o u r t h Connect dialog box should look similar to Figure 6.23.
18.
Click on the
Connect
button in the lower-right area of the dialog box.
For the last connection, we will create the active report variable first and then use it to
connect the control and the container.
19.
In the Interactive Behavior dialog box, click on the drop-down menu under the
Control
heading at the top of the dialog box and change the selection to
ProductLine Buttons
.
20.
Click on the
Manage Active Report Variables
link in the lower-left corner of the dialog box.
The Active Report Variables dialog box is displayed and should look like Figure 6.24.