Database Reference
In-Depth Information
8.
Va l i d a t e t h e e x p r e s s i o n a n d c l i c k
OK
.
9.
Double-click the
Range
data item and modify the data item expression to the following:
'More than 20'
10.
Va l i d a t e t h e e x p r e s s i o n s a n d c l i c k
OK
.
Step 6: Build the FinalQuery
1.
Mouse over the
Query Explorer
tab and click on the
FinalQuery
query to access the
data items.
NOTE
Because all three queries have the same query item names in the same order, we
did not have to modify
Union
properties and project the data item names.
2.
Ctrl-click
Range
and
Count
data items and drag them into the
Data Items
area of the
query design pane.
3.
From the
Data Items
pane, select the
Range
data item and change the
Aggregate Func-
tion
property to
None
.
4.
Select the
Count
data item and change the
Aggregate Function
property to
To t a l
.
We want to add up all the records so that the end result will have only three records.
These records will represent the total number of orders that closed within the three spec-
ified ranges.
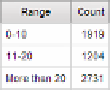
5.
From the
Run
menu, select
View Tabular Data
for results similar to those shown in
Figure 5.15. Click
OK
in the warning message window.
Figure 5.15
Ta b u l a r data view of the FinalQuery
6.
Close the
IBM Cognos Viewer
window to return to IBM Cognos Report Studio.
Step 7: Set Up the Chart
1.
In the
Explorer Bar
, mouse over the
Page Explorer
tab and select
Page1
.
2.
From the
Data Items
tab of the
Insertable Objects
pane, expand the
FinalQuery
data
items and drag the
Range
data item into the
Categories (x-axis)
drop zone of the
Chart
.