Environmental Engineering Reference
In-Depth Information
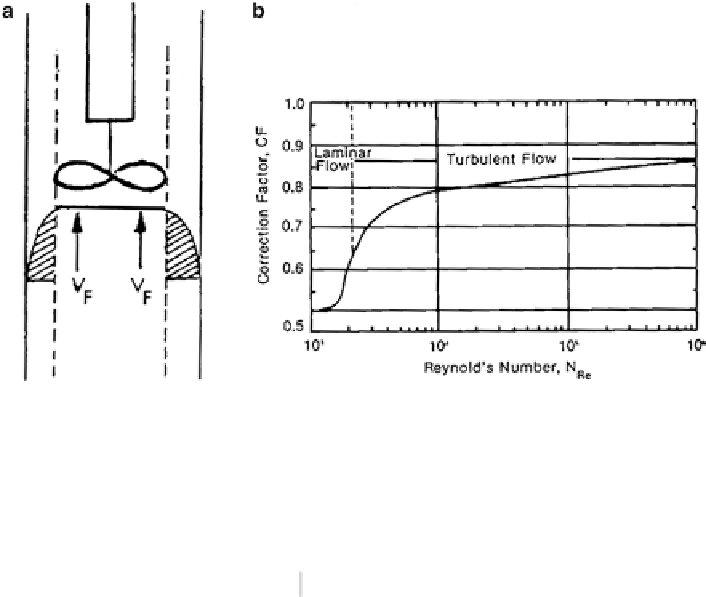
Figure
5.12a
shows the position of the tool in the flow stream together with the flow
profile. The flow profile across the pipe is a function of the Reynolds number (see
overestimate true flow rate. The correction factor as a function of the Reynolds
number is shown in Fig.
5.12b
. In most cases, this factor is between 0.84 and 0.85.
It is applied as follows:
V
=
V
´
Correctionfactor
.
superficial
measured
Fig. 5.12
Flowmeter correction factor. (
a
) Courtesy Schlumberger and (
b
) Courtesy Baker Atlas
Question #5.1
A flowmeter survey completed 6 passes. The cable speed, direction, and corre-
sponding spinner rps were as follows:
Tool speed (ft/min) rps
rps
Logging down
10
5
60
10
110
15
Logging up
−110
−5
−160
−10
−210
−15
(a) Plot these points on linear graph and determine the fluid speed.
(b) Use a correction factor of 0.85 and determine the flow rate in B/D for 7-in. 20-lb
pipe.


Search WWH ::

Custom Search