Environmental Engineering Reference
In-Depth Information
near wellbore happenings that produce changes in pressure and hence deformation
of the fiber optic cable may be monitored and displayed in a sound field display.
Figure
14.13
gives an illustration.
Fig. 14.13
DAS sound field display (
left
) and DTS display (
right
). Courtesy SPE 152422
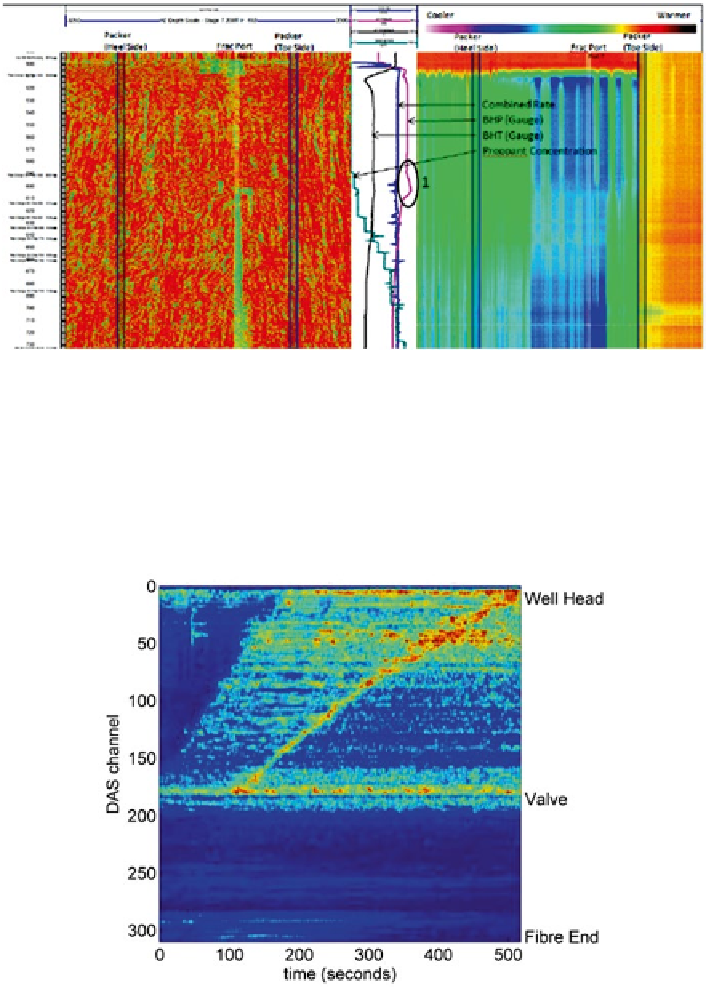
DAS can be used to monitor the gas lift valve performance. In this approach,
DAS fiber will collect the coherent light sources at the valve and along the tubing.
With this, the operator can track the opening and closing of the valve as well as the
slug flow and the exact velocity of the slug as it reaches the surface in real time.
Fig. 14.14
DAS-recorded acoustic energy (
red
: high,
blue
: low) during startup of a gas lift opera-
tion. Courtesy SPE 150203
Search WWH ::

Custom Search