Environmental Engineering Reference
In-Depth Information
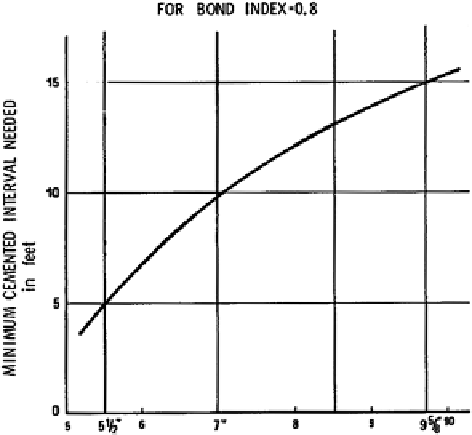
Fig. 12.20
Minimum
requirements for hydraulic
seal. Courtesy Schlumberger
Wave-Train Signatures
Figure
12.21
neatly summarizes the various patterns that may appear on a wave-
train display such as the VDL. Typically, the VDL Track will be scaled 0-1,000 or
200-1,200
s represent the time after the transmitter fi res
but before the fi rst arrival at the 5-ft receiver. The next few hundred microseconds
represent casing arrivals closely followed by formation arrivals, with mud arrivals
coming last. The clue to reading VDL displays lies in observing the relative strength
of the signals in these time intervals. For example, in free pipe, casing arrivals will
be strong and formation arrivals weak. In well-bonded pipe, casing arrivals will be
weak and formation arrivals strong, etc. By observing the amplitude, the transit
time, and the VDL display, any condition of cementation can be diagnosed.
ʼ
s. The fi rst 200 or 250
ʼ
F r e e P i p e
Free pipe will exhibit: (1) steady travel time, with casing collars visible, (2) high
amplitude (~50 mV), with casing collars giving a 10- to 15-mV reduction over a 3-ft
depth interval and (3) a VDL display with parallel black and white bands showing
chevron patterns at casing collars over a 5-ft depth interval. No formation arrivals
will be visible. Figure
12.22
illustrates a free pipe log.
Search WWH ::

Custom Search