Environmental Engineering Reference
In-Depth Information
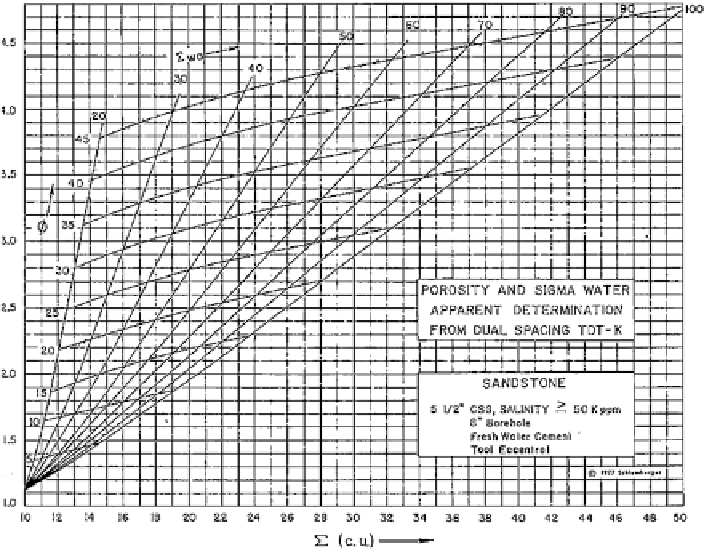
Sigma-Ratio Crossplot
If no open-hole logs are available one essential piece of information will be missing,
namely, the porosity. Fortunately there is a method for finding porosity from pulsed
neutron logs. It requires only the value of sigma and ratio, read directly from the log.
These two readings are then cross-plotted to give porosity. A side benefit is that the
plot also gives values of ʣ
wa
, the apparent capture cross section of the water.
Figure
11.29
gives an example of this type of chart.
Fig. 11.29
Determination of ˕ and ʣ
wa
from ʣ and ratio
It should be noted that many different charts are available form service compa-
nies that cover a multitude of different casing sizes and formation water salinities.
The particular chart used here for illustrative purposes was built for 5½″ casing and
water salinity >50 Kppm NaCl.
Question #11.10. ʣ-Ratio Crossplot
A log is run in 5½″ casing with an 8-5/8″ open-hole. The borehole fluid salinity is
80,000 ppm NaCl; ʣ
Log
= 20 cu and the ratio = 2.8.
(a) Find
˕
= ____________ %
(b) Find ʣ
wa
= ___________ cu
Search WWH ::

Custom Search