Environmental Engineering Reference
In-Depth Information
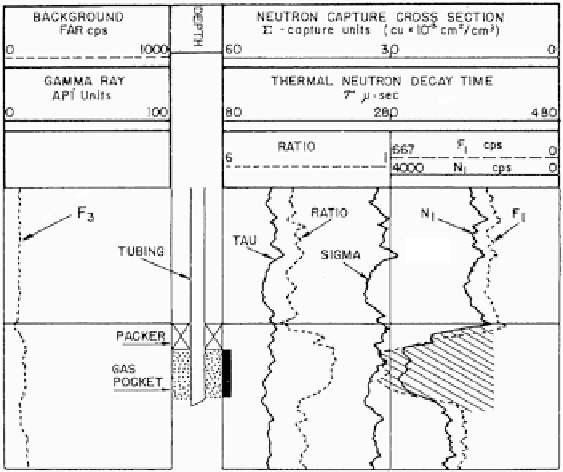
Fig. 11.18
Ratio curve response to gas. Courtesy Schlumberger
Near and Far Count-Rate Display
In Track 3, the near and far count rates are displayed as an overlay. Figure
11.19
illus-
trates this presentation. When the correct scales are chosen for the near (
N
1
) and far (
F
1
)
count-rate displays, a useful quick-look log results, with the following properties:
• In 100 % water (section A),
F
1
=
N
1
• In gas (section C),
F
1
>
N
1
(dotted line is left of solid)
• In shales (at the top of the log),
F
1
<
N
1
(dotted line right of solid)
Question # 11.2
Refer to Fig.
11.19
(a) Color code the gas-bearing intervals on the near/far count-rate display using red
or pink.
(b) Color code the shale zone at the top of the log green.
(c) Why do you think the oil-water contact is marked where it is (i.e., at 4,535 ft)?
(d) Read the average value of ʣ in the water-bearing zone.
Search WWH ::

Custom Search