Environmental Engineering Reference
In-Depth Information
Sigma Curve
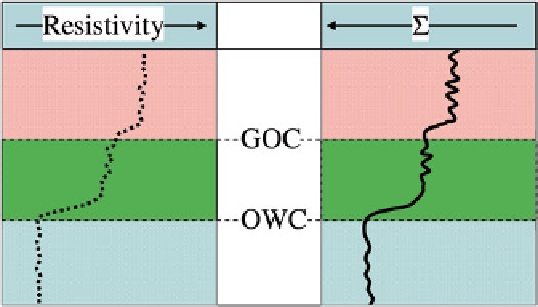
The ʣ curve is the principal pulsed neutron measurement and behaves rather like
an open-hole resistivity curve, that is, it delects to the left (high values of ʣ) in
wet zones and to the right (low values of ʣ) in hydrocarbon-bearing zones or low-
porosity formations. ʣ values in shales are quite high, tending to mask the effect of
hydrocarbons. Thus shaly pay zones can appear to be water-bearing on the first
inspection. Figure
11.17
shows a schematic comparison of ʣ with resistivity.
Fig. 11.17
ʣ-resistivity comparison
Tau Curve
Tau is just another way of looking at ʣ. In fact, ˄ (the decay-time constant for the
thermal-neutron population) is the basic measurement of a pulsed neutron tool.
However, all interpretation equations for pulsed neutron logs are linear functions of
ʣ; and it is much easier to work with ʣ rather than with ˄. It is recommended that ˄
be recorded, but left off the log presentation, since its scaled reciprocal, ʣ, gives
exactly the same information in a form that is easier to work with.
Ratio Curve
The ratio curve is a porosity indicator. It is derived by taking the ratio of the gamma
ray counts seen at the near and far detectors respectively. The ratio curve behaves
very much like a compensated thermal-neutron (CNL) porosity curve, i.e., it deflects
to the right (low ratio) in low porosity, or in the presence of gas. Figure
11.18
shows
the ratio curve response to a pocket of gas trapped below a packer behind a tubing
nipple. In the absence of any open-hole porosity logs, the ratio can be used in com-
bination with ʣ to ind formation porosity.
Search WWH ::

Custom Search