Environmental Engineering Reference
In-Depth Information
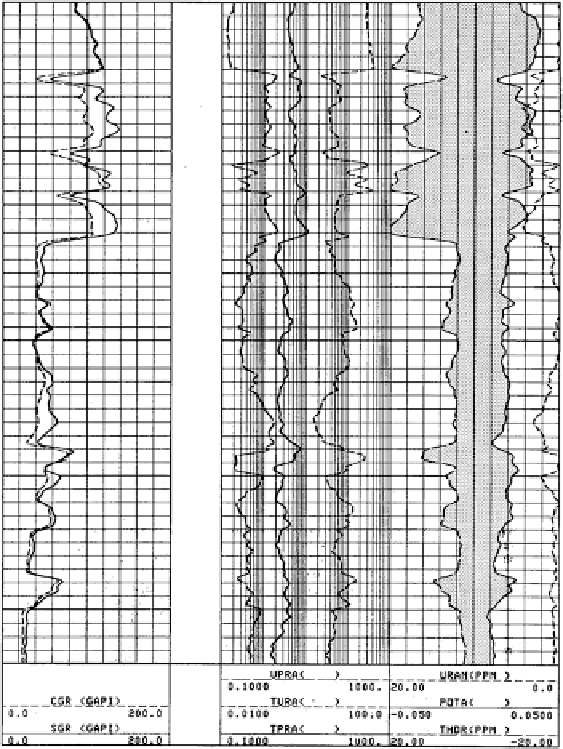
Field presentations of gamma ray spectra can assist the analyst in the task of
mineral identification by offering curve plots with ratios of the three components
(U, Th, and K) already computed. Figure
11.13
gives an example of one such pre-
sentation. Track 1 shows total gamma ray together with a uranium-free curve. Track
2 gives three ratios, uranium/potassium, thorium/uranium, and thorium/potassium.
Track 3 gives a coded display on which the coded area represents the formations
with both the highest potassium and the highest thorium content.
Fig. 11.13
Th, K, and U ratios display. Courtesy Schlumberger
Search WWH ::

Custom Search