Environmental Engineering Reference
In-Depth Information
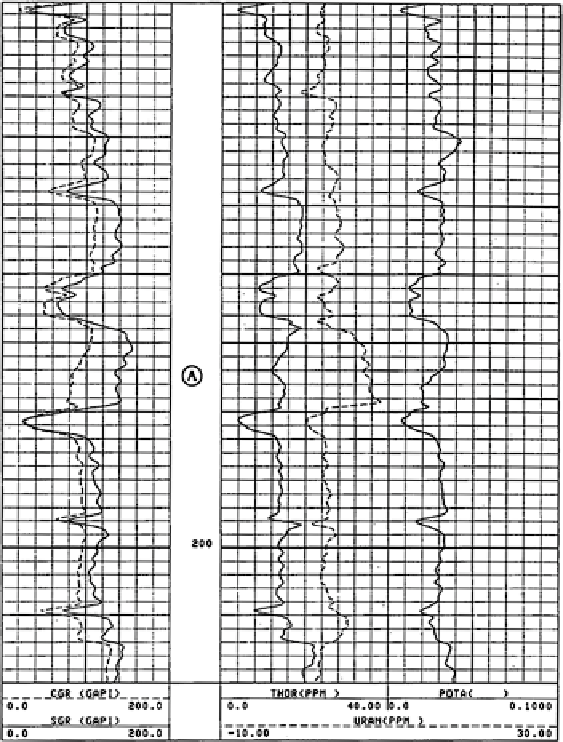
Question #11.1
In the example shown in Fig.
11.10
, determine which element is responsible for the
high activity seen on the total gamma ray intensity curve at the point marked A.
Fig. 11.10
Spectral gamma ray log. Courtesy Schlumberger
Interpretation of Natural Gamma Ray Spectra Logs
Several techniques are in use for the interpretation of natural gamma ray spectra
logs. One is the use of the uranium curve as an indicator of fractures. This is more
fully described by Fertl et al. More recently the development of unconventional
reservoirs has benefited for the presence of uranium in organic shales that may be
hydraulically fractured (fracked) and produced. In these formations the uranium
content is often related to the total organic carbon (TOC) content of the formation.
Search WWH ::

Custom Search