Environmental Engineering Reference
In-Depth Information
Figure
9.4
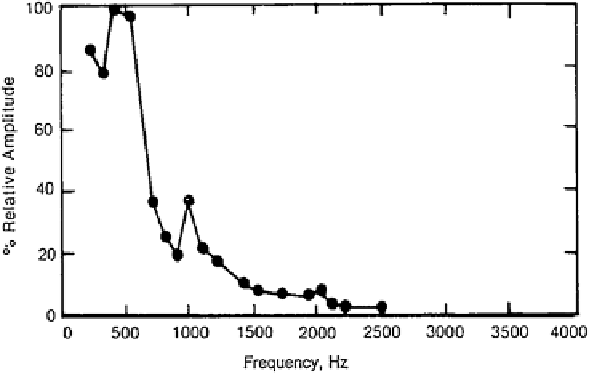
shows a very different spectrum, obtained when 0.3 Mcf/D of gas
expands into a water-fi lled channel. Here the peak noise is at less than 500 Hz.
Fig. 9.4
Noise spectrum for two-phase fl ow (gas/water). Courtesy Baker Hughes
In order to distinguish these spectra from one another, the total signal is fi ltered
through band-pass fi lters that allow the frequencies
≥
200+,
≥
600+,
≥
1,000+, and
≥
2,000+ Hz to pass. The choice of limits on these bands varies somewhat between
different service companies. Since the 200-Hz fi lter allows all frequencies above
200 Hz to pass, this fi lter normally gives the highest amplitude. The 2,000-Hz fi lter,
which only allows frequencies above 2,000 Hz to pass, normally gives the lowest
amplitude. Figure
9.5
illustrates the band-pass fi lter response.
Fig. 9.5
Filter response in
noise logging. Courtesy
Baker Atlas

Search WWH ::

Custom Search