Environmental Engineering Reference
In-Depth Information
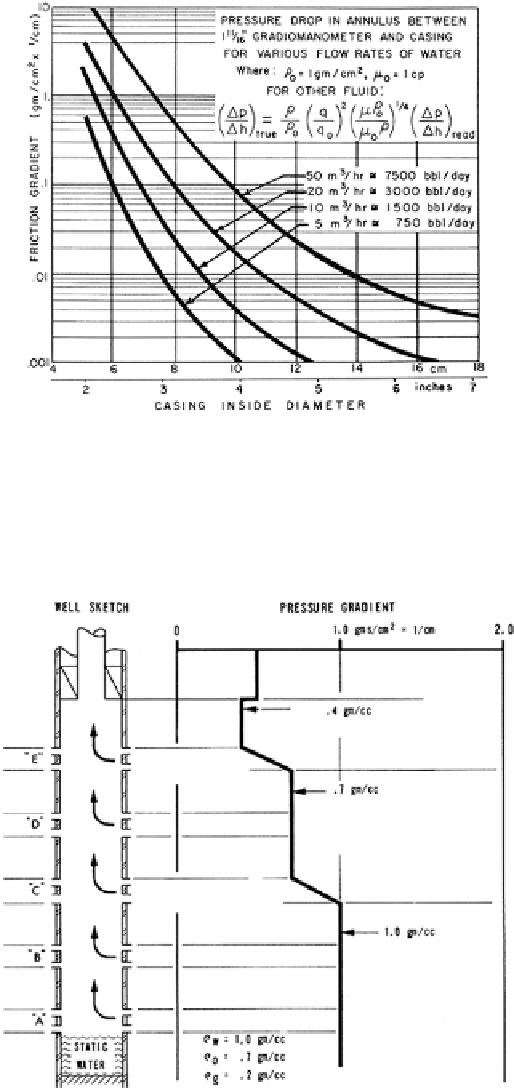
Figure
7.3
shows the expected friction gradient as a function of pipe ID and flow
rate. In normal circumstances (5½- or 7-in. casing), the friction term is negligible.
Fig. 7.3
Friction gradients caused by fluid flow in small pipe. Courtesy Schlumberger
Figure
7.4
shows a gradiomanometer recording. The tool is logged continuously
up (or down) the hole and records fluid density vs. depth. The log is normally
recorded with a sensitivity of 1 g/cm
3
per log track. An amplified curve with 5-10
times the sensitivity is commonly recorded as well.
Fig. 7.4
Gradiomanometer log. Courtesy Schlumberger
Search WWH ::

Custom Search