Environmental Engineering Reference
In-Depth Information
(a)
(b)
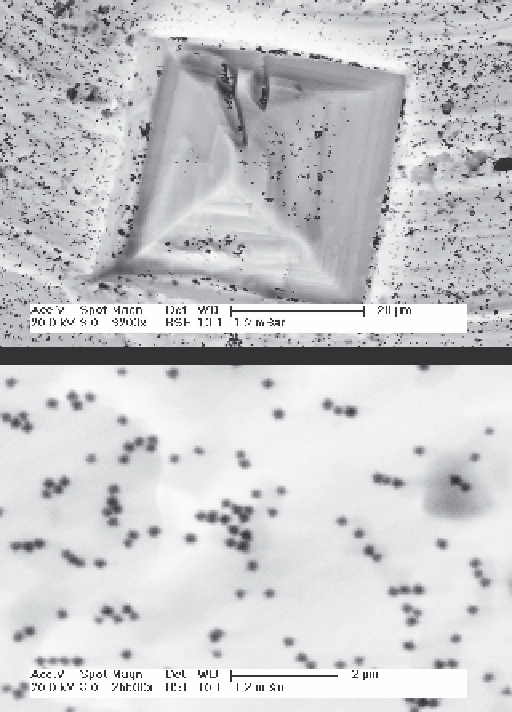
Figure 6.11
Individual HgS nanoparticles dispersed on (a) NaCl crystals and aluminium
and (b) on carbon recorded in an ESEM (XL30, FEG, FEI). Due to the strong elemental con-
trast of the particles compared to the background, the particles can clearly be resolved using
the BSE signal.
dark fi eld imaging or selected area electron diffraction (SAED). A comprehensive
treatment of TEM is written in a very user friendly way by Williams and Carter
(1996) .
In the TEM, electrons pass through the sample, and thus the samples have to be
electron transparent, or in other words very thin. The maximal thickness of the
sample depends on its composition (atomic weight) and on the energy of the elec-
trons (acceleration voltage). The maximum sample thickness increases with increas-
ing acceleration voltage and with decreasing atomic number of the sample. However,
it also depends on the kind of analysis being performed. If only the morphology of
the particles is of interest, then the particles can be up to a few
m. However, for
analytical (electron energy loss spectroscopy (EELS) or energy dispersive X-ray
µ
Search WWH ::

Custom Search