Environmental Engineering Reference
In-Depth Information
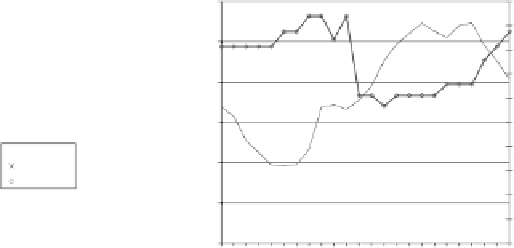
overall observations of particle number size distributions (Charron
et al.
, 2008a ),
the diurnal profi le of the smallest particles (
<
30 nm) is different to that of larger
particles (
30 nm) (Figure 5.8). The integrated particle counts between 30- 100 and
100-450 nm have similar daily profi les with lower median numbers during daytimes
and higher median numbers during nighttimes, as a result of stronger dispersion in
the boundary layer during daytime (and the weak contribution of local emissions),
while the integrated particle counts between 11- 30 nm show higher concentrations
during daytime (afternoon) and are anticorrelated with the daily variations of the
modal diameter of particle number size distributions (Figure 5.8).
At background sites and/or at sites where new particle formation is frequently
observed, a seasonal pattern is generally observed, with higher frequency and
intensity of new particle formation during the warmer season, while the precise
seasonal variation differs at each individual site (Kulmala
et al.
, 2004 ). However, it
is often observed that spring and, to a lesser extent, autumn are more favourable
seasons for nucleation events than summer. The spring maximum could be partly
explained by the seasonal variation of solar radiation, with a peak in June and
higher levels from May to July, and/or the possible role of higher biological activity
that produces precursor gases during spring (Vehkamä ki
et al.
, 2004 ). Nilsson
et al.
(2001) have associated the seasonal cycle of nucleation events at Hyytiä l ä , Finland
(spring and autumn maxima and a summer minimum), with the higher frequencies
of arctic air masses and the larger latitudinal temperature difference responsible
for higher cyclone activity at that time of the year. The fi ndings of Charron
et al.
(2007) for Harwell, UK, are in agreement with the hypothesis of Nilsson
et al.
(2001) The annual distribution of nucleation events at Harwell during the 1999-
2001 period is represented in Figure 5.9.
On the other hand, at urban British sites dominated by traffi c emissions, a sea-
sonal pattern with higher concentrations in the winter and lower concentrations in
the summer is observed (Harrison and Jones, 2005) (Figure 5.6). This pattern
>
1200
3000
1200
50
45
1000
2500
1000
40
35
800
800
2000
30
600
1500
600
25
20
N(11-30)
N(100-450)
N(30-100)
N(11-30)
modal diameter
400
1000
400
15
10
200
500
200
5
0
0
0
0
Time (h)
Time (h)
(a)
(b)
Figure 5.8
(a) Median daily cycles of integrated particle counts for the ranges 11-30 nm,
30-100 nm and 100-450 nm. (b) Median daily cycles of the 11-30 nm integrated particle
counts and of the smaller mode of particle number size distribution. (Charron
et al.
, 2008b)


Search WWH ::

Custom Search