Environmental Engineering Reference
In-Depth Information
40000
6000
N(11-30 nm)
Light duty traffic
Heavy-duty traffic
Particle surface area
5500
35000
5000
30000
4500
4000
25000
3500
20000
3000
2500
15000
2000
10000
1500
1000
5000
500
Sun
Mon
Tue
Wed
Thu
Fri
Sat
0
0
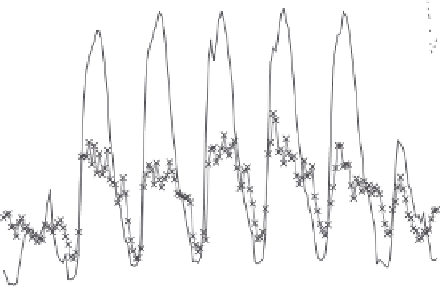
Figure 5.1
Median integrated particle numbers for particle sizes ranging from 11 to 30 nm
from Scanning Mobility Particle sizer and median weekly cycles for light duty traffi c (cars
and motorcycles) and heavy duty traffi c (lorries, cars, coaches) at Marylebone Road, London.
(Reprinted from A. Charron and R.M. Harrison, Primary particle formation from vehicle emis-
sions during exhaust dilution in the roadside atmosphere,
Atmospheric Environment
,
37
,
4109-19. Copyright 2003, with permission from Elsevier.)
90000
80000
Night
Morning rush hour
Midday
Afternoon rush hour
70000
60000
50000
40000
30000
20000
10000
0
1
0
1
0
1
0
0
Dp (nm)
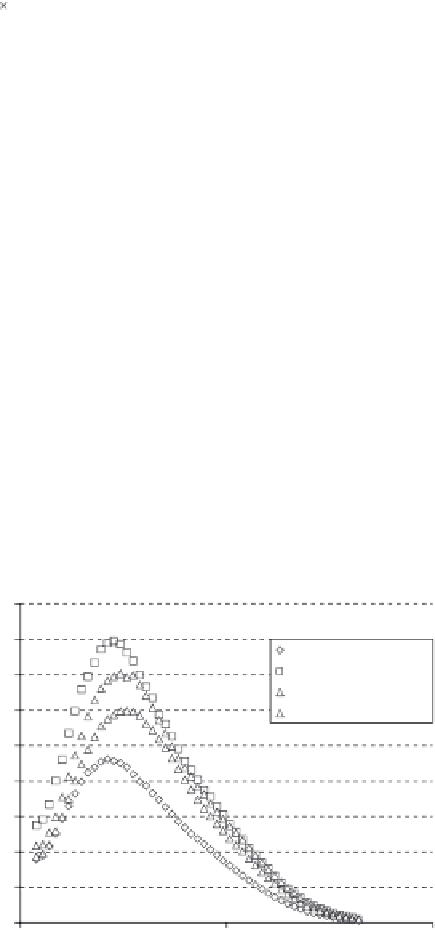
Figure 5.2
Median particle size distributions measured at Marylebone Road, London on
weekdays from 1999-2001. (Reprinted from A. Charron and R.M. Harrison, Primary particle
formation from vehicle emissions during exhaust dilution in the roadside atmosphere,
Atmospheric Environment
,
37
, 4109-19. Copyright 2003, with permission from Elsevier.)


Search WWH ::

Custom Search