Environmental Engineering Reference
In-Depth Information
the process is very slow as the activation energy is high. However, oxidation rates
much faster than can be accounted for by pure abiotic mechanisms have been
measured and were explained by microbial catalysis of the oxidation process
(Chapnick
et al.
, 1982; Moffett and Ho, 1996; Sunda and Huntsman, 1987). It has
been stated that the only process of manganese oxidation in freshwater, marine
and terrestrial environments is bacteria-mediated oxidation (Filella, 2007). The
microbial-mediated formation of manganese oxide particles was reported in various
freshwater systems (Lienemann
et al.
, 1997 ; Tani
et al.
, 2003 ). Manganese
(hydr)oxides have proven diffi cult to identify in aquatic and terrestrial environ-
ments due to their low concentrations. Manganese (hydr)oxides often occur as
small crystals and are often intermixed with (hydr)oxides of iron or with organic
matter (Figure 4.2), or as coatings on mineral surfaces and biofi lms (Chen
et al.
,
2000 ; Dong
et al.
, 2000, 2001). Consequently, they are diffi cult to separate from the
colloidal matrix and even more diffi cult to concentrate or purify.
Silica (SiO
2
) can be encountered in the environment as the mineral quartz or its
polymorphs. Silica colloids can be released during the diagenesis of amorphous
silica. In addition, some plankton (diatoms, estimated to accounts for 40% of
primary activity in the ocean (Nelson
et al.
, 1995)) construct their exoskeletons
from silica, which become part of colloidal or particulate pool (biogenic silica) in
the aquatic environment after diatom death. Diatoms in fresh and salt water extract
silica from the water to use it as a component of cell wall. The global production
of biogenic silica is dominated by diatoms. The silicon cycle, the formation of bio-
genic silica and the factors determining the rate of silica production and removal
in surface waters have been reviewed in detail elsewhere (Nelson
et al.
, 1995 ;
Ragueneau
et al.
, 2000 ).
1.2
1.0
UV/VIS
Al
Fe
Mn
Pb
0.8
0.6
0.4
0.2
0.0
0
0
50
100
150
200
250
hydrodynamic radius (nm)
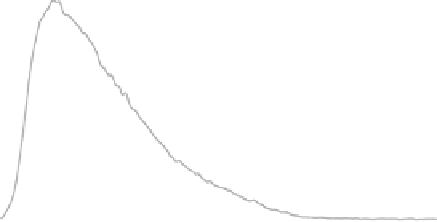
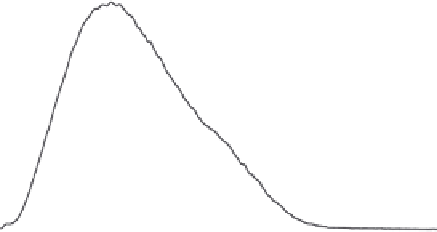
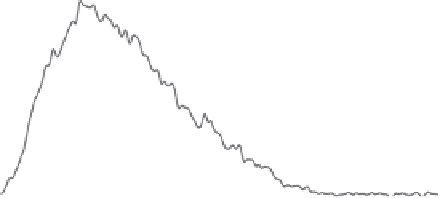
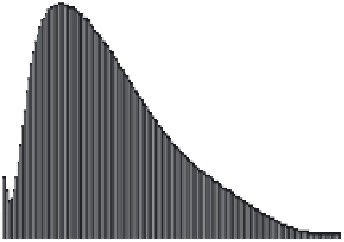
Figure 4.2
FFF-ICPMS relative particle and element size distribution of aquifer colloids. The
grey area represents the UV/VIS signal at 260 nm (as turbidity) and is a measure for the total
colloid concentration. The coloured traces show the distribution of the major elements iron,
aluminium and manganese and of the trace element lead. The signals are scaled to fi t the
graph. (v.d. Kammer, Doubascoux, Lespes, unpublished.) (See colour plate section for a
colour representation)


Search WWH ::

Custom Search