Agriculture Reference
In-Depth Information
1.47. times. larger. than. that. of. fruits.. China. alone. accounts. for. about. 60%. of. the.
world's.production.and.50%.of.the.world's.vegetable.production.area..India.is.second.
to. China. in. vegetable. production. in. the. region. primarily. because. majority. of. the.
population.are.vegetarian.
19
.About.14.9%.of.the.country's.total.farm.area.in.India.is.
being.utilized.for.vegetable.growing.
20
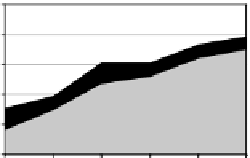
Figure.7.1.shows.an.increasing.trend.in.the.area.harvested,.volume.of.production,.
consumption,.and.yield.of.vegetables.and.fruits.in.Asia,.as.well.as.globally..The.yield.
of.vegetables.in.Asia.remains.higher.than.the.world's.average,.while.the.yield.of.
fruit.species.though.lower.in.the.past.decade.has.also.surpassed.the.world's.average.
in. 2007.. Northeast. Asian. countries. like. China,. Japan,. North. Korea,. South. Korea,.
and. Taiwan. in. particular. have. higher. per. capita. consumption. and. production. of.
horticultural.crops.than.other.countries.in.the.region.
Vegetables
Fruits
60
60
50
50
40
40
30
30
20
20
10
10
0
0
1997
1999
2001
2003
2005
2007
1997
1999
2001
2003
2005
2007
450
800
400
700
350
600
300
500
250
400
200
300
150
200
100
100
50
0
0
1993
1995
1997
1999
2001
2003
1993
1995
1997
1999
2001
2003
1000
600
900
500
800
700
400
600
500
300
400
200
300
200
100
100
0
0
1997
1999
2001
2003
2005
2007
1997
1999
2001
2003
2005
2007
180
1050
1000
175
170
950
165
900
160
850
155
800
1997
1999
2001
2003
2005
2007
1997
1999
2001
2003
2005
2007
Asia World
FIGURE 7.1
Selected.indicators.on.production.and.consumption.of.vegetables.and.fruits.in.
Asia.and.the.World,.1997-2007..(Data.from.Food.and.Agriculture.Organization.of.the.United.
Nations,.Rome,.Italy,.FAOSTAT.database,.http://faostat.fao.org,.accessed.October.28,.2009.)


Search WWH ::

Custom Search