Environmental Engineering Reference
In-Depth Information
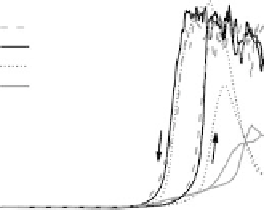
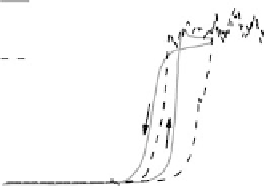
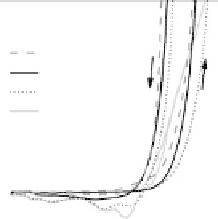
Figure 14.12 CO bulk electro-oxidation at PtRu alloys. (a, b) Pt
x
Ru
12x
/Ru(0001) (x ¼ 0.07,
0.25, 0.47) surface alloys measured in a flow cell with a CO-saturated electrolyte. (c) Freshly
sputtered Pt
0.5
Ru
0.5
bulk alloy in a rotating disk electrode setup (data from Gasteiger et al.
[1995]), compared with a Pt
0.53
Ru
0.47
/Ru(0001) surface alloy.
In the negative-going scan, the current remains at the same constant value for the
medium and high Pt content samples (x ¼ 0.25 and 0.47), until it decays steeply at
about 0.75 V, and vanishes completely at 0.51 V. For the low Pt content sample, the
situation is somewhat different, since the current increases first, essentially following
the current trace of the positive-going scan, down to about 0.8 V, where it bends off
and decays steeply at 0.69 V. For all surface alloys, we observe a negative current
below 0.55 V, which for the low Pt content electrode (x ¼ 0.07) has a voltammetric
profile very similar to that of the Pt
0.23ML
/Ru(0001) surface. This points to a similar


Search WWH ::

Custom Search