Environmental Engineering Reference
In-Depth Information
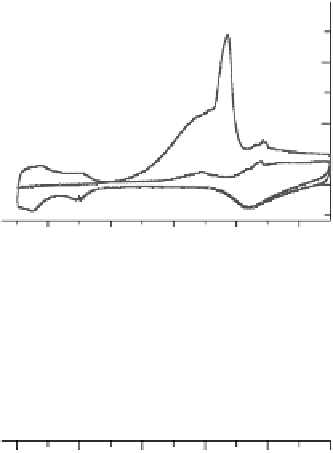
Figure 12.8 CO-saturated electrolyte in the thin cell of Fig. 12.2. (a) CO oxidation; the first
and second scans are shown. (b) Comparison with the CO stretch frequency shift. (Filled circles
denote linear Stark tuning behavior while open circles correspond to deviations from linear
behavior during oxidation.)
12.4.2 SFG Spectra of Adsorbate Phase Transition Kinetics
CO on single-crystal Pt(111) [Lagutchev et al., 2006] evidences new phase behavior
[Villegas and Weaver, 1994; Tolmachev et al., 2004; Wang et al., 2005; Lucas et al.,
1999] not seen on poly Pt. We have studied the adlayer phase transition between a
(2
2)23CO structure and a slightly less dense (
p
19
p
)R23.48213CO lattice
[Lagutchev et al., 2006], depicted in Fig. 12.9. This adlayer phase transition is an
excellent model system to understand dynamical transformations in electrochemical
surface science. A representative SFG amplitude, frequency and width are plotted in
Fig. 12.10 with a 0.1 M H
2
SO
4
electrolyte and a potential sweep rate of 5 mV/s.
The phase transition highlights a sudden atop intensity jump and is accompanied by
the transformation of 3-fold sites into bridge sites (Fig. 12.9) [Villegas and Weaver,
1994; Tolmachev et al., 2004; Wang et al., 2005; Lucas et al., 1999]. At lower poten-
tials (,0.53 V), atop and 3-fold signals are observed (Fig. 12.11a), representing the
(2
2)23CO lattice consisting of atop CO sites (25% coverage) surrounded by 3-fold
sites (50% coverage). At higher potentials (.0.53 V), the atop intensity jumps, and the
3-fold sites are converted to bridge sites, resulting in a (
19
1
p
)R23.48213CO
structure of the atop CO (the atop CO coverage is 0.368) surrounded by bridge-bonded
dimers (the bridge-bonded CO coverage is 0.316) (Fig. 12.11b).
p
19


Search WWH ::

Custom Search