Environmental Engineering Reference
In-Depth Information
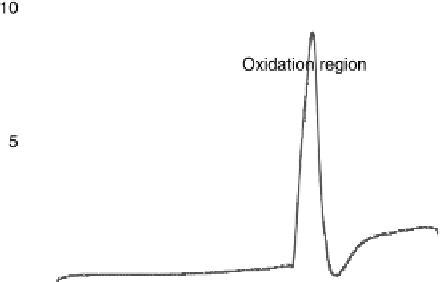
Figure 12.5 CO stripping voltammogram with a CO-free 0.1 M H
2
SO
4
electrolyte. Compare
the data in Fig. 12.4: the CO oxidation region begins at V ¼ 0.43 V. After CO stripping, hydro-
gen adsorption/desorption peaks and the beginning of the Pt oxidation range are shown.
Figure 12.6 Comparison (using a 0.1 M H
2
SO
4
CO-free electrolyte) of the SFG amplitude of
the CO stretch (filled circles) with electric charge (open circles). The charge is computed by
numerical integration of the current shown in Fig. 12.5.


Search WWH ::

Custom Search