Environmental Engineering Reference
In-Depth Information
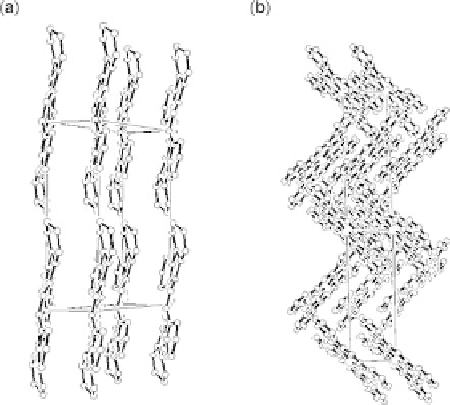
Figure 11.16 Schematic orientation of the planar FePc molecules in the crystallographic cell:
(a) a-FePc calculated from the data obtained by Ballirano and co-workers [Ballirano et al.,
1998]; (b) b-FePc calculated from the data obtained by Kirner and co-workers [Kirner et al.,
1976].
co-workers pointed out the similarity of the structure of the a- and b-forms between
CoPc and FePc [Ballirano et al., 1998].
a-FePc led to a shift of the reduction wave of 100 mV towards higher potentials
than for b-FePc, and to higher absolute values of current densities in the diffusion
plateau (Fig. 11.17). Tafel plots derived from these polarization curves give the
following:
†
For an a-FePc/C electrode, there is a first slope for potentials between 850 and
700 mV vs. RHE, with a value of 265 mV/decade (2.3 RT/F ), and a second one
for potentials lower than 700 mV, with a value of 2121 mV/decade (2.3 RT/
0.5F ). These values are close to those observed at Pt electrodes [Damjanovic
and Bockris, 1966; Gnanamuthu and Petrcelli, 1967; Damjanovic et al., 1967;
Sepa et al., 1986a, b; Toda et al., 1999a, b].
†
For b-FePc, only one Tafel slope could be observed, with a value close to 263
mV/decade.
These facts indicate that two mechanisms are involved, depending on the electrode
potential in the case of a-FePc whereas only one mechanism seems to be involved
in the case of b-FePc.
At Pt electrodes, adsorption of oxygen species is supposed to be controlled by the
Temkin isotherm in the low overpotential region [Damjanovic and Bockris, 1966],
whereas in the higher overpotential region, the absence of an oxide layer leads to


Search WWH ::

Custom Search